The stock market got off to a pretty good start at the beginning of last week, with solid gains on Monday and Tuesday. By contrast, the bond market continued to see selling pressure, but it was relatively contained.
Of course, the big event traders and investors were waiting for came on Wednesday as that was the day the FOMC policy statement was released along with subsequent comments from Chairman Ben Bernanke. The Fed Chair indicated that if economic conditions continued to improve, the Fed might reduce its rate of bond purchases later this year and perhaps end them altogether by mid-2014. He further indicated that the Fed would not sell securities as long as the market remained in a normalization stage.
The stock market responded with sizable losses, effectively erasing the previous two days of gains. The bond market followed suit. AGG, which is Barclay's Aggregate Bond Fund (similar to our F fund), saw price fall to levels not seen since June of 2012.
On Thursday, both the stock and bond markets picked up where they left off, as the major averages fell much lower. That day saw significant technical breakdowns in the charts as support was broken decisively.
Friday was Options Expiration (OPEX), which saw stocks close mixed, but the bond market continued its descent. The 10 Year Note saw its yield close at its highest level since August 2011. This is particularly notable as the 10 Year Note is generally tied to mortgage rates.
So the action this past week reflects uncertainty across both stock and bond markets. And the market does not like uncertainty.
Given the dynamics now at play, I would take nothing for granted about where this market is headed in the weeks and months ahead. It's still a bull market, and the major stock averages are still sporting solid yearly gains, but this market is one that now appears to have changed in character.
Let's take a look at this week's charts.
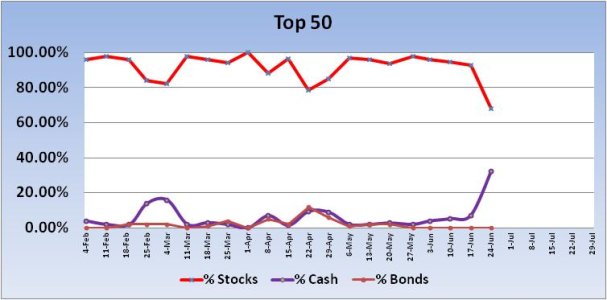
The Top 50 saw their largest weekly drop in stock exposure since October of 2012. Stock exposure fell 24.88% from a total of 92.68% last week to 67.8% this week. That's a buy signal (in a bull market) for next week. However, given the transition this market appears to be going through, I would not throw caution to the wind on this signal. It does suggest we'll see at least some measure of a rally next week, but I'm not so sure we'll see a weekly gain in the major averages. We might, buy there's too much churn right now to bet big on it.
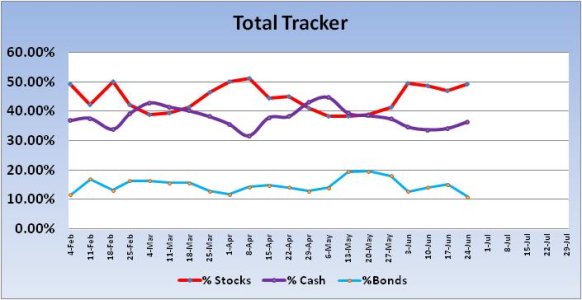
The Total Tracker actually saw some dip buying last week, as total stock allocations rose 2.38% to a total allocation of 49.31%. No signal here.
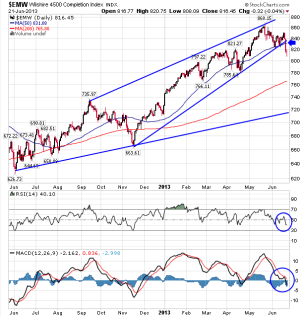
Looking at the Wilshire 4500, we can see that price has fallen below both the 50 dma and the intermediate term trend line. Decisively. There is another longer term trend line below, but before we get to that level price would have to fall well below the 200 dma. Each is a possible target, but I'm not looking that far ahead. It could be that the powers that be do not want to go there and may increase support once again. It's just too early to know. But in the short term, we can see momentum (MACD) is negative and heading lower. RSI is also moderately negative. I'd have to conclude that lower prices are coming in the weeks ahead based on this chart.
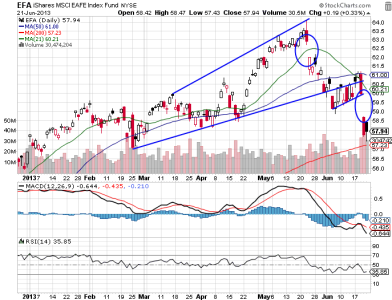
The EAFE (similar to the I fund) is in worse shape than either the S&P 500 or Wilshire 4500. There's been two big gaps lower in recent weeks, with the last one coming last Thursday. Price has been slicing through both intermediate and short term trend lines. And it hasn't been able to close above the 50 dma since late May. MACD is very negative and pointing lower, while RSI is quite negative, but not oversold just yet. Yes, we're due for a bounce now, but I don't like the longer term picture being painted here. Note that the 200 dma is not far off now.
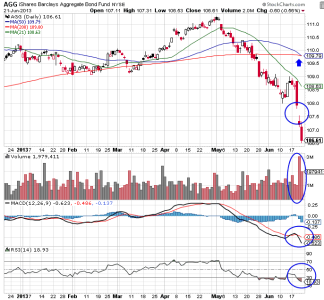
AGG (equivalent to our F fund) is a chart that's also painting a bearish picture. With yields rising, interest rates will be impacted. And that includes mortgage rates. How much more selling pressure can the market take without tipping over should yields continue their ascent? In this chart, we can see that the 50 dma is now right at the 200 dma and pointing lower. The last three trading days saw significant downward pressure on price with a sizable gap lower coming on Thursday. And there's volume behind this movement too. MACD, already quite negative to the downside, is suggesting price is heading lower still. RSI has been moving lower since the beginning of May and has spent a good deal of time in oversold territory for about a month now.
Our sentiment survey is on a decided buy for next week, with 29% bulls vs. 63% bears. That's usually good for some measure of a rally the following week. Especially given the Top 50 buy signal. But it bears repeating that this market may be in transition. That probably spells volatility in a market that is likely moving lower in the intermediate term. Yes, there can be some very big short term rallies under current market conditions, but they are likely to be selling opportunities rather than a change in trend.
On another note, this is likely my last blog. Not because I'm leaving the board, but because I will be transitioning out of Government service in the months ahead. I am currently looking to retire next January, but that date has an outside chance of being extended, so it's not quite a lock. What is a lock, is that I will retire in FY14 regardless. Now, I'll only be at my minimum retirement age when I leave and I'm not ready to retire from working at this point, but I am very much ready to begin a new chapter in my life doing something else. And I've got several options available to me. I have given this a lot of thought for several months now and have decided to offer a premium service on TSP Talk as early as next January.
Doing a premium service would allow me to really focus on market analysis and I could expand on the content of what I'm currently providing. The alternative for me is to work somewhere in the private sector, which is okay too, but it will impact my time on the board more than it already is.
So I plan to offer a weekly analysis in the premium area of TSP Talk and will be as active as I can be on the message board in the same area during the week as well. But remember, I'm still working full time, so I'll still have my limitations. The good news is that you'll get more content from me in the months ahead for free as I won't actually go premium until I'm retired. And that content won't be limited to just TSP. I'll be offering technical analysis on individual stocks and bonds as part of an overall portfolio management platform. I'll explain more about that in the near future. For now, I look forward towards this transition and hope to see you in the premium area beginning next week.
Of course, the big event traders and investors were waiting for came on Wednesday as that was the day the FOMC policy statement was released along with subsequent comments from Chairman Ben Bernanke. The Fed Chair indicated that if economic conditions continued to improve, the Fed might reduce its rate of bond purchases later this year and perhaps end them altogether by mid-2014. He further indicated that the Fed would not sell securities as long as the market remained in a normalization stage.
The stock market responded with sizable losses, effectively erasing the previous two days of gains. The bond market followed suit. AGG, which is Barclay's Aggregate Bond Fund (similar to our F fund), saw price fall to levels not seen since June of 2012.
On Thursday, both the stock and bond markets picked up where they left off, as the major averages fell much lower. That day saw significant technical breakdowns in the charts as support was broken decisively.
Friday was Options Expiration (OPEX), which saw stocks close mixed, but the bond market continued its descent. The 10 Year Note saw its yield close at its highest level since August 2011. This is particularly notable as the 10 Year Note is generally tied to mortgage rates.
So the action this past week reflects uncertainty across both stock and bond markets. And the market does not like uncertainty.
Given the dynamics now at play, I would take nothing for granted about where this market is headed in the weeks and months ahead. It's still a bull market, and the major stock averages are still sporting solid yearly gains, but this market is one that now appears to have changed in character.
Let's take a look at this week's charts.

The Top 50 saw their largest weekly drop in stock exposure since October of 2012. Stock exposure fell 24.88% from a total of 92.68% last week to 67.8% this week. That's a buy signal (in a bull market) for next week. However, given the transition this market appears to be going through, I would not throw caution to the wind on this signal. It does suggest we'll see at least some measure of a rally next week, but I'm not so sure we'll see a weekly gain in the major averages. We might, buy there's too much churn right now to bet big on it.

The Total Tracker actually saw some dip buying last week, as total stock allocations rose 2.38% to a total allocation of 49.31%. No signal here.

Looking at the Wilshire 4500, we can see that price has fallen below both the 50 dma and the intermediate term trend line. Decisively. There is another longer term trend line below, but before we get to that level price would have to fall well below the 200 dma. Each is a possible target, but I'm not looking that far ahead. It could be that the powers that be do not want to go there and may increase support once again. It's just too early to know. But in the short term, we can see momentum (MACD) is negative and heading lower. RSI is also moderately negative. I'd have to conclude that lower prices are coming in the weeks ahead based on this chart.

The EAFE (similar to the I fund) is in worse shape than either the S&P 500 or Wilshire 4500. There's been two big gaps lower in recent weeks, with the last one coming last Thursday. Price has been slicing through both intermediate and short term trend lines. And it hasn't been able to close above the 50 dma since late May. MACD is very negative and pointing lower, while RSI is quite negative, but not oversold just yet. Yes, we're due for a bounce now, but I don't like the longer term picture being painted here. Note that the 200 dma is not far off now.

AGG (equivalent to our F fund) is a chart that's also painting a bearish picture. With yields rising, interest rates will be impacted. And that includes mortgage rates. How much more selling pressure can the market take without tipping over should yields continue their ascent? In this chart, we can see that the 50 dma is now right at the 200 dma and pointing lower. The last three trading days saw significant downward pressure on price with a sizable gap lower coming on Thursday. And there's volume behind this movement too. MACD, already quite negative to the downside, is suggesting price is heading lower still. RSI has been moving lower since the beginning of May and has spent a good deal of time in oversold territory for about a month now.
Our sentiment survey is on a decided buy for next week, with 29% bulls vs. 63% bears. That's usually good for some measure of a rally the following week. Especially given the Top 50 buy signal. But it bears repeating that this market may be in transition. That probably spells volatility in a market that is likely moving lower in the intermediate term. Yes, there can be some very big short term rallies under current market conditions, but they are likely to be selling opportunities rather than a change in trend.
On another note, this is likely my last blog. Not because I'm leaving the board, but because I will be transitioning out of Government service in the months ahead. I am currently looking to retire next January, but that date has an outside chance of being extended, so it's not quite a lock. What is a lock, is that I will retire in FY14 regardless. Now, I'll only be at my minimum retirement age when I leave and I'm not ready to retire from working at this point, but I am very much ready to begin a new chapter in my life doing something else. And I've got several options available to me. I have given this a lot of thought for several months now and have decided to offer a premium service on TSP Talk as early as next January.
Doing a premium service would allow me to really focus on market analysis and I could expand on the content of what I'm currently providing. The alternative for me is to work somewhere in the private sector, which is okay too, but it will impact my time on the board more than it already is.
So I plan to offer a weekly analysis in the premium area of TSP Talk and will be as active as I can be on the message board in the same area during the week as well. But remember, I'm still working full time, so I'll still have my limitations. The good news is that you'll get more content from me in the months ahead for free as I won't actually go premium until I'm retired. And that content won't be limited to just TSP. I'll be offering technical analysis on individual stocks and bonds as part of an overall portfolio management platform. I'll explain more about that in the near future. For now, I look forward towards this transition and hope to see you in the premium area beginning next week.
