Call Me Ishmael - Account Talk

CallMeIshmael

New member
I've been following the rest of you the past year or so and finally signed up today. This is my first post.

Had a couple good decisions this year, including moving from S fund to G July 13 before the Fall, and smiling as I waited for a chance to buy again much lower. And a not-so-good decision entering S again Aug 24 when it was rising. I got scared as it started going down fast again in Sept., and remembered the maxim I learned (the hard way) in 2000: Rule #1 - Preserve Your Capital. I got out effective Sept 6, losing only about a percent. Of course I had a little regret when it bounced off the bottom again and I missed last week's 5% rise entirely, but I'm happily missing the current fall too.

If it bounces off lows again I may get back in for a week. But I agree with those who say the whole business is likely to go much lower before it gets much higher.

Ominous now is the head and shoulders, a warning.
 
Welcome to the Message Board Ishmael. This is a very good time to move with caution, I've been waiting for the Market to bust out of this Bear Flag and now H&S since Aug 24th and it's been plenty tempting but I fought the urge. Tomorrow is another day.
Best of luck:D
Norman
 
Welcome Ishmael . Glad you decided to get involved :D as I can use all the help I can get.

Plenty to learn here and plenty to share.

Sounds like you have a good plan.

Good Luck Trading !!
 
Despite the excitement of a 7% gain this week I think the next move is more likely to be down than up. There have been three attempts to move above 1250 on the S&P since late Oct., each weaker than the one before, and we're at the cusp of the fourth. In fact, with today's retreat from a 1-1/2% intra-day increase, I think we just saw the fourth attempt. On the DJIA these Four Tops lead back to the last high of July, suggesting that from then until now we have been in a steady decline that has resisted breakout.

The other side of the coin is that the market is in an up-trend since the late September low of 1075 on the S&P, up through last week's low of 1155, and giving support today at 1170 or 1175.

Of course we're in both. So we're in a transition (that's not news!), but to what? The lines we're between form a triangle whose lower and upper legs will meet in three weeks at about 1210 on the S&P. (If we connect the highs of July and October the line is a little more gradual, and meet at 1240 a little later.) The DJIA corresponds, with the legs meeting around 11,900 in 4-5 weeks. So it'll have to break out above or below one of these lines by then.

I think we'll break downward for several reasons. The main one fundamental, that despite the gradually improving economic figures, the whole world economy is this house of cards built on debt. The US's economy depends on consumer spending and that also is based on consumer debt. I think we're reaching the unthinkable, just as we did with the 2000 stock market bubble burst, the more recent housing bubble burst, and the banks' near meltdown with surviving banksters obviously not learning a single lesson from it yet. This incredible debt, not just in the US but the whole industrialized world except China (with its own looming problems of one-party rule), together with a concentration of extreme amounts of wealth n the hands of a smaller and smaller percentage of people -- this just can't go on forever. That much is just my opinion. everyone will have their own, and I don't claim to have more insight than anybody else.

The other reason is when you look at the really long term the charts don't look good. I looked at the S&P from about 93 to the present with quarterly frequency. You see a huge head-and shoulder pattern -- the first shoulder in '99, a neckline of 800, the head in '07, and the second shoulder in July of this year. This won't stop being a shoulder until the market exceeds July's highs, and if it does it's still a shoulder if it collapses before reaching 1550.

I realize I have a 49% chance of being wrong. OK, a 51% chance. OK, more. One day at a time. But we'll know more in 10 months at the latest. That's when the descending trend above us (Oct. '07 high on the S&P 500 down through July '11) meets with the ascending one below us (from March '09 through last month's lows). Any breakout above or below prior to that time will give us a little more confidence in saying we're in a trend one way or another.

In the meantime I'm going to try to make what I can on the oscillations. Still learning. Making mistakes, like staying greedy and staying in after making 5% in Oct. then again 4% in Nov., and not taking my profits and relaxing until another opportunity comes. This time I did -- got in (cautiously, only 50%) Nov. 28 when the market showed it had bottomed, then got out when it fantastically rose on Nov. 30. (So I can aford to be pessimistic! If I'm right this time, I'll get another chance if/when the shares go back down!) I'm going to aim for singles and doubles for a while, not home runs. I don't think I have the timing for that yet. While everyone's so excited about the 7% solution this past week, we're still 2% below where we were three weeks ago if we stayed in the whole time.

I really like Tom's daily comments. I'm new enough at this to learn a lot from them, and feel that if I knew more I'd still be reading what he pulls together from so many sources and his experience. I often get ideas contrary to what I'd been thinking myself, or better, get turned on to topics and ideas I had no opinion about before because I did not know they existed or mattered.
 
Welcome aboard. Looks like you have good information to share. You will fit in fine. Looking forward to more insight.
 
Back in 100% S today. I'd been waiting until a pullback to the Nov. 30 high, or below, to prove a consolidation. It hit that yesterday. I felt so smart last night. But it looks like everyone else was waiting for the same thing, because today is re-doing what was undone yesterday, so I'll be back in tonight after today's rise. The whole low-volatility box from Nov. 30 to today is uncannily repeating -- almost day by day -- the box of Oct. 11-21. S&P resistance at 1270, 1290, and 1320. The lowest it can go and still be in an uptrend from Oct. 3 is around 1190-1200.
 
I sold yesterday morning because I wanted to lock in a 3% gain so far this year. It's not much, but when you consider some hedge funds are bragging that they got that much all of last year, I figure it's not bad for less than 2 weeks' effort. A start. What if I could get 3% every month this year -- 36%! And I think the market is more likely to drop from this point, at least a little, than to have a meaningful breakout, i.e. a decisive one, with strong volume. Not likely right now with all the bad news from Europe.

I decide a few days ago to get ouyt if there's a little pop because I missed the chance to do it twice near the end of last year. A good illustration was the last week in October, when there was a 5% pop in one day. WHy not just get out? I thought about it. But I got greedy, didn't want to miss another 5% pop the next day It fell instead and I lost what I had. Lesson learned -- bird in hand... Take good profits when they're handed to you.

Yesterday's pop looked like the right one -- 1% jump at the opening, but declining throughout the morning. This was not going to last, so I took my first IFT of the year.

3% per month is actually my goal but so far I haven't seen the entry point yet. :(
I also won't try to make up for a month of less then 3%, as that can quickly lead to hole digging.
 
When all the experts and forecasts agree - something else is going to happen. Bond yields are ignoring good economic data. A change is coming.
 
From Tom's TSP Talk Blog Jan. 4, "Hanging On," referring to the dollar:
]
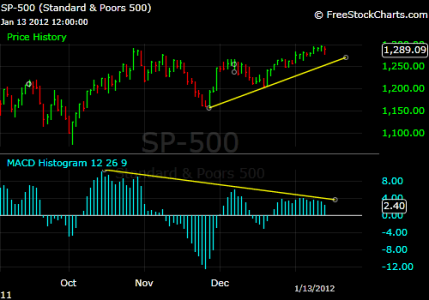
"The MACD indicator along the bottom shows that we are seeing a negative divergence in the dollar where the indicator is dropping while the dollar trend was rising. We saw a similar divergence in the fall that preceded a sharp decline after peaking in early October."

Does this apply to the
S&P 500 as well?

SPX - 01-13-12 - MACD divergeance.png

Is this a sign the current price rise is weaker than it appears? Or am I reading this wrong?

Together with the fact that this breakout from an inverse head-and-shoulders has been on weak volume and has not (yet) included a pullback to the neckline to consolidate before really taking off, I'm thinking of waiting for a bigger drop before buying. If that doesn't happen, I'll have to rethink this. Who knows?

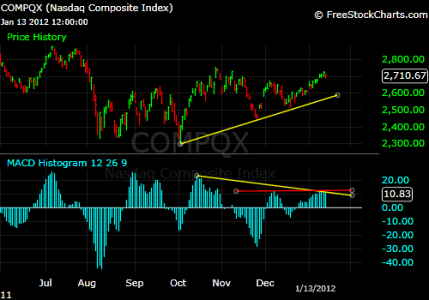
(NASDAQ shows MACD declinefrom Oct. but rise from Dec.... If it's the leader, does that change this scenario?)
 

Attachments

  • COMP - 01-13-12 - MACD divergeance and convergeance.png
    COMP - 01-13-12 - MACD divergeance and convergeance.png
    24.7 KB · Views: 35
Back
Top