Last week, my tracker data revealed that the Top 50 had reduced their collective stock exposure by 17.9%. And that anytime this group reduced stock exposure by more than 10% (in a bull market) the market often went the other way the following week.
Well, the market went the other way as the S fund gained 2.29%, the C fund picked up 1.75% and the I fund tacked on a whopping 3.68%.
This week, there are no signals from the Top 50. Here's the charts:
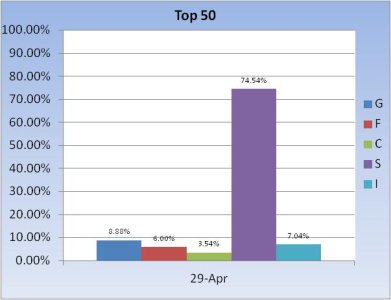
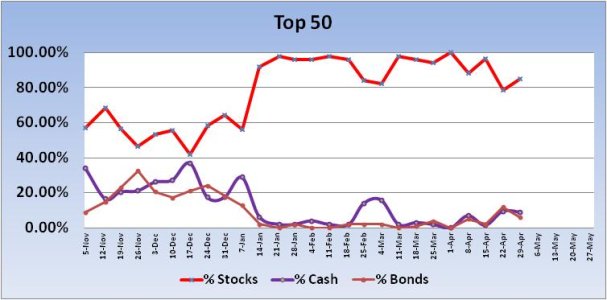
The Top 50 bumped up stock exposure by 6.52% to a total stock allocation of 85.12%.
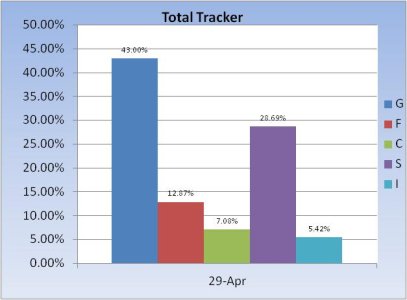
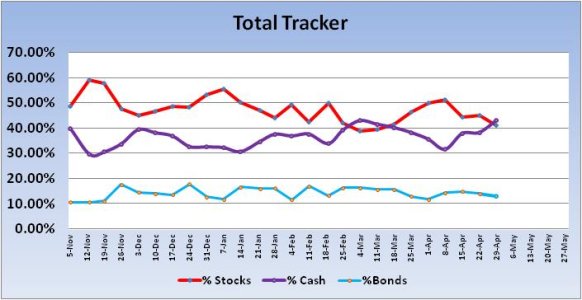
The Total Tracker showed a decrease in stock allocation of 3.82% going into the new trading week. Their collective exposure is only 41.19%. Longer term, that's bullish.
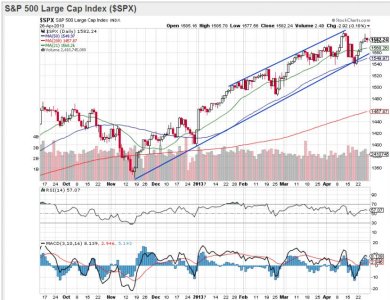
The S&P 500 continues to look like a bullish chart. Price is above the 21 dma and is centered between the upper and lower trend lines. RSI is showing moderate strength, while momentum is positive. Friday's weakness, which was largely bought again, may carry over into the early part of this week, but I'd not expect anything too dramatic on the downside.
Our sentiment survey remained on a hold (buy) with a neutral signal. That also suggests to me that a bit more downside may be in the cards.
May 1st is almost here (sell in May and go away), but I'm not bearish longer term. At least not yet. There's still a lot of underlying strength coming into this market and if the Total Tracker's collective stock exposure of just 41.19% (there's 1,084 folks on the tracker) is anywhere near how the masses are invested, there's still plenty of fuel available to drive prices even higher. But with record gains and all time highs being hit, one has to wonder what it will take to get the average investor bullish again. Because until sentiment gets much more bullish (and complacent), price is likely to trek higher.
Well, the market went the other way as the S fund gained 2.29%, the C fund picked up 1.75% and the I fund tacked on a whopping 3.68%.
This week, there are no signals from the Top 50. Here's the charts:


The Top 50 bumped up stock exposure by 6.52% to a total stock allocation of 85.12%.


The Total Tracker showed a decrease in stock allocation of 3.82% going into the new trading week. Their collective exposure is only 41.19%. Longer term, that's bullish.

The S&P 500 continues to look like a bullish chart. Price is above the 21 dma and is centered between the upper and lower trend lines. RSI is showing moderate strength, while momentum is positive. Friday's weakness, which was largely bought again, may carry over into the early part of this week, but I'd not expect anything too dramatic on the downside.
Our sentiment survey remained on a hold (buy) with a neutral signal. That also suggests to me that a bit more downside may be in the cards.
May 1st is almost here (sell in May and go away), but I'm not bearish longer term. At least not yet. There's still a lot of underlying strength coming into this market and if the Total Tracker's collective stock exposure of just 41.19% (there's 1,084 folks on the tracker) is anywhere near how the masses are invested, there's still plenty of fuel available to drive prices even higher. But with record gains and all time highs being hit, one has to wonder what it will take to get the average investor bullish again. Because until sentiment gets much more bullish (and complacent), price is likely to trek higher.
