There were no auto-tracker signals last week and our sentiment survey came in with 58% bulls and 30% bears, which was modestly bearish. I noted that stock allocations across the auto-tracker dipped and that this has been bullish all year. And with liquidity at very high levels I had to expect higher prices by the end of the week. And that’s what we got, as the S&P was up 0.88%, the Wilshire 4500 eked out a 0.42% gain and the EFA tacked on 0.44%.
This week, there are no auto-tracker signals. The Total Tracker (auto-tracker) saw stock allocations rise modestly by 1% to a total stock allocation of just 45.31%. That's bullish longer term.
Our sentiment survey didn't change much from last week as bulls remained at 58%, while bears increased from 30% to 34%. I view our survey as modestly bearish. Earlier this past week I showed you some AAII sentiment data that was interesting. Generally speaking, sentiment is a contrarian indicator and should be treated as such. This past week AAII came in at 49.2% bulls and 17.6% bears, which at face value is bearish. But I looked at this data from January 2010 to present (almost 4 years) and isolated those weeks where bearish sentiment was under 20% for this survey. There were 6 weeks. And every one of them saw positive action the week following the survey. So they have not been a fade at these bearish levels in some time. Something to consider.
Let's look at the charts:
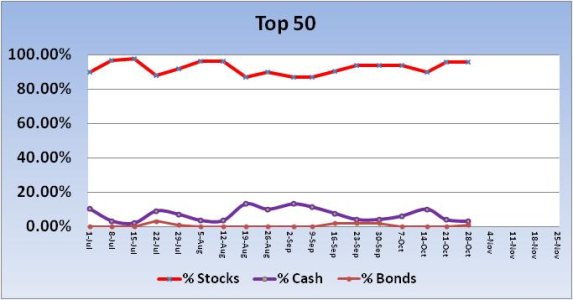
No signal from the Top 50 this week. For the new trading week, total stock allocations remain the same at 95.88%.
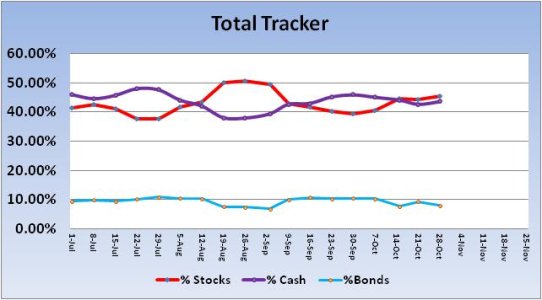
No signal was generated from the Total Tracker this week. Stock allocations rose 1.0% to a total stock allocation of 45.31%. As I've already mentioned, that’s bullish longer term.
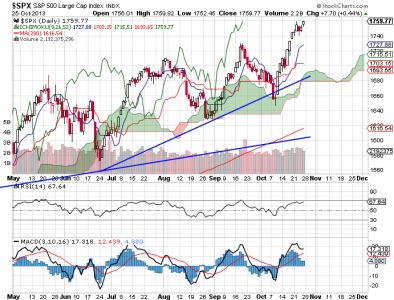
The S&P 500 continues to look bullish, albeit extended, like most of the indexes. Price remains well above the cloud and most of the indicators are bullish. MACD is high and appears to be weakening a bit, but RSI remains pretty strong.
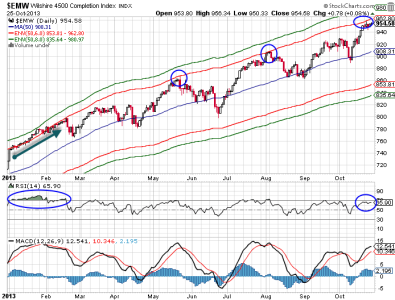
The Wilshire 4500 tagged the upper 6% envelope last week. This is an area that has seen pullbacks the last two times it hit this level (May, August). However, if you look at the January-February timeframe, you can see that price ran along this level for several weeks. That was because liquidity was pouring into the market (as show by the overbought condition of RSI). We aren't overbought currently. So upside pressure isn't currently as intense as it was at the beginning of the year.
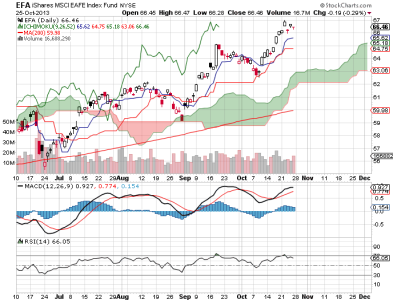
The EFA (I fund) also looks bullish, but extended. Momentum is very positive as is RSI.
So sentiment is somewhat supportive of more upside next week. But more importantly, underlying support (liquidity) remains robust. As long as that remains the case, the downside will remain limited.
To see this week's full analysis, follow this link http://www.tsptalk.com/members/
This week, there are no auto-tracker signals. The Total Tracker (auto-tracker) saw stock allocations rise modestly by 1% to a total stock allocation of just 45.31%. That's bullish longer term.
Our sentiment survey didn't change much from last week as bulls remained at 58%, while bears increased from 30% to 34%. I view our survey as modestly bearish. Earlier this past week I showed you some AAII sentiment data that was interesting. Generally speaking, sentiment is a contrarian indicator and should be treated as such. This past week AAII came in at 49.2% bulls and 17.6% bears, which at face value is bearish. But I looked at this data from January 2010 to present (almost 4 years) and isolated those weeks where bearish sentiment was under 20% for this survey. There were 6 weeks. And every one of them saw positive action the week following the survey. So they have not been a fade at these bearish levels in some time. Something to consider.
Let's look at the charts:

No signal from the Top 50 this week. For the new trading week, total stock allocations remain the same at 95.88%.

No signal was generated from the Total Tracker this week. Stock allocations rose 1.0% to a total stock allocation of 45.31%. As I've already mentioned, that’s bullish longer term.

The S&P 500 continues to look bullish, albeit extended, like most of the indexes. Price remains well above the cloud and most of the indicators are bullish. MACD is high and appears to be weakening a bit, but RSI remains pretty strong.

The Wilshire 4500 tagged the upper 6% envelope last week. This is an area that has seen pullbacks the last two times it hit this level (May, August). However, if you look at the January-February timeframe, you can see that price ran along this level for several weeks. That was because liquidity was pouring into the market (as show by the overbought condition of RSI). We aren't overbought currently. So upside pressure isn't currently as intense as it was at the beginning of the year.

The EFA (I fund) also looks bullish, but extended. Momentum is very positive as is RSI.
So sentiment is somewhat supportive of more upside next week. But more importantly, underlying support (liquidity) remains robust. As long as that remains the case, the downside will remain limited.
To see this week's full analysis, follow this link http://www.tsptalk.com/members/
