Last week, our sentiment survey was a bit on the bearish side with 57% bulls and seasonality was weak. But the auto-tracker showed another dip in stock allocations, which has been bullish this year. I was leaning bullish myself, but was not overly enthused about the upside with the sentiment and seasonality headwinds. But the S and I funds managed to move higher last week, which was consistent with the drop in stock allocations. Although, the C fund was down more than 1%, so it was mixed bag for those holding the C fund.
This week, sentiment saw a significant decline in bulls, falling from 57% last week to 40% this week. That's a bullish reading.
Also, stock allocations dipped again. More upside? Take a look at the charts and data.
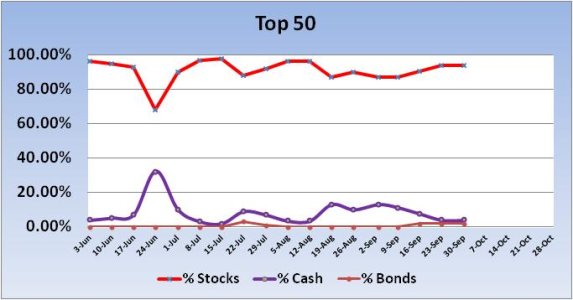
The Top 50 had no changes from last week and are holding a total stock allocation of 94%.
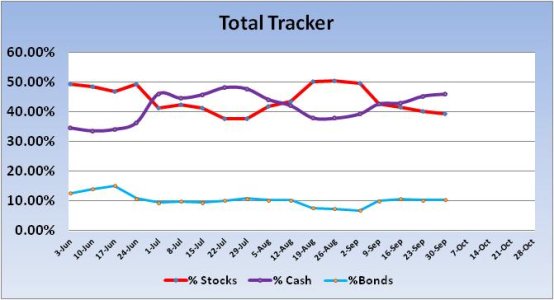
The Total Tracker saw stock allocations dip another 0.75%. That's bullish by itself, but total stock allocations fell below 40%. That's bullish too.
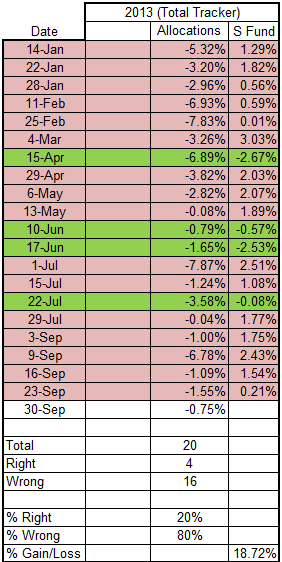
Here is the data for this year. It shows each week that stock allocations fell across the auto-tracker and how our stock funds fared the following week as a result. Eighty percent of the time when stock allocations fell on a weekly basis, the market saw prices advance. And if you were invested in the S fund for just those weeks, you would be up 18.72%.
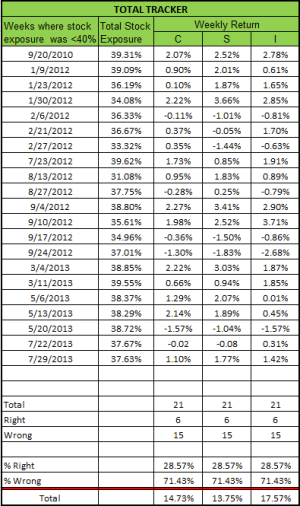
As I mentioned above, when total stock allocations fall below 40%, the market tends to advance. This chart shows those weeks when total stock allocations met that criteria. More than 71% of time stocks advanced when allocations were that low.
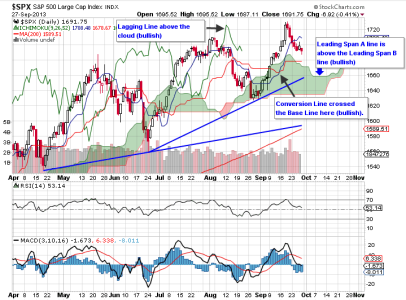
While the S&P 500 has been weak of late (S&P 500), no serious technical damage has been done (as yet). And really, the chart above appears bullish (longer term) using the Ichimoku clouds as a guide. I also left in the rising trend support lines for additional reference points. RSI is in decline and not far from the neutral line. MACD had a negative signal line cross last week. My read on this chart is that the downside may not be over in the short term. I’d look for the 1660 area as the first line of support, which is about where the rising technical support line is as well as the Leading Span A line.
So I have bullish sentiment, bullish stock allocation data, weak seasonality, and a potential Government shutdown for the new trading week. I would normally be leaning bullish here, but that shutdown is an unknown as far as how the market might react. Logic suggests to many of us that the market would decline in the event of a shutdown. Perhaps. But logic doesn't generally work well in the stock market. My guess is that we're going to see some downside action this week, but we'll probably also see some upside. In other words, I think it may be a volatile week.
To see this week's full analysis, follow this link http://www.tsptalk.com/members/
This week, sentiment saw a significant decline in bulls, falling from 57% last week to 40% this week. That's a bullish reading.
Also, stock allocations dipped again. More upside? Take a look at the charts and data.

The Top 50 had no changes from last week and are holding a total stock allocation of 94%.

The Total Tracker saw stock allocations dip another 0.75%. That's bullish by itself, but total stock allocations fell below 40%. That's bullish too.

Here is the data for this year. It shows each week that stock allocations fell across the auto-tracker and how our stock funds fared the following week as a result. Eighty percent of the time when stock allocations fell on a weekly basis, the market saw prices advance. And if you were invested in the S fund for just those weeks, you would be up 18.72%.

As I mentioned above, when total stock allocations fall below 40%, the market tends to advance. This chart shows those weeks when total stock allocations met that criteria. More than 71% of time stocks advanced when allocations were that low.

While the S&P 500 has been weak of late (S&P 500), no serious technical damage has been done (as yet). And really, the chart above appears bullish (longer term) using the Ichimoku clouds as a guide. I also left in the rising trend support lines for additional reference points. RSI is in decline and not far from the neutral line. MACD had a negative signal line cross last week. My read on this chart is that the downside may not be over in the short term. I’d look for the 1660 area as the first line of support, which is about where the rising technical support line is as well as the Leading Span A line.
So I have bullish sentiment, bullish stock allocation data, weak seasonality, and a potential Government shutdown for the new trading week. I would normally be leaning bullish here, but that shutdown is an unknown as far as how the market might react. Logic suggests to many of us that the market would decline in the event of a shutdown. Perhaps. But logic doesn't generally work well in the stock market. My guess is that we're going to see some downside action this week, but we'll probably also see some upside. In other words, I think it may be a volatile week.
To see this week's full analysis, follow this link http://www.tsptalk.com/members/
