Last week, the Top 50 increased their collective stock allocations by a sizable 16.6%. In response the "S" fund fell 1.69%, while the "C" fund dropped 1.9%. The week before that the Top 50 had dropped stock allocations by 13.3% and the "S" fund rallied 2.27% and the "C" fund 1.21%. See a pattern here? That's just the very short term, but they've been on the wrong side of the market more times than not when stock allocations move by more than 10%.
This week, the Top 50 has increased stock allocations yet again, this time by 5.9% to a total stock allocation of 64.4%.
Here's the charts:
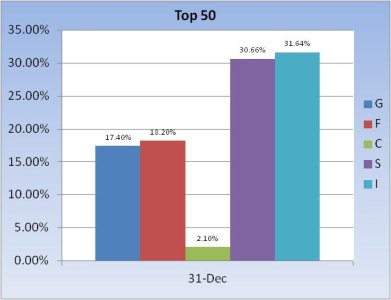
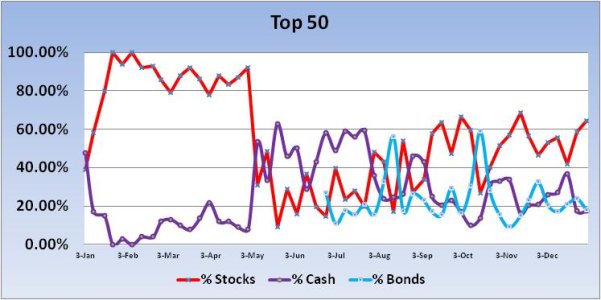
As I mentioned, total stock allocations for this group sit at 64.4% going into the week.
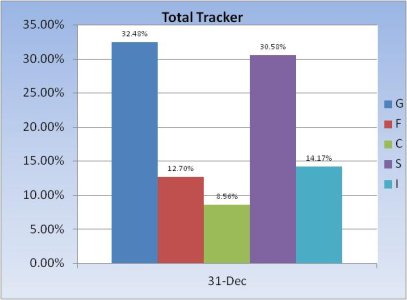
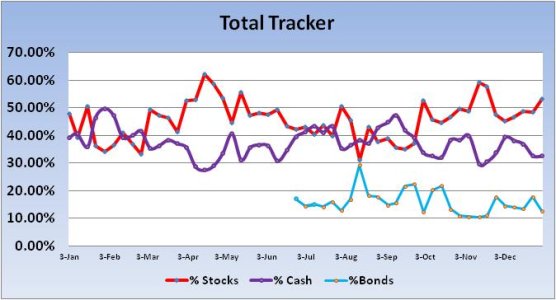
The Total tracker bumped up their stock allocations by 4.68% to a total allocation of 53.32%.
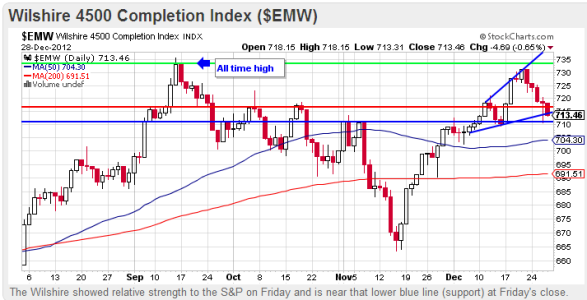
I'm posting the chart of the Wishire 4500 again this week. While the closing price on the S&P 500 has fallen below its 50 dma, the Wilshire 4500 has remained well above it. Last Thursday, this index bounced off support near the 710 level (horizontal blue line) and closed above the lower trend line. Friday, the index fell again, but didn't drop as far as Thursday and closed right at that lower trend line.
While this chart certainly doesn't look ugly at the moment (dicey, but not ugly), price is poised to fall much further given futures fell hard after Friday's close. That doesn't necessarily mean we'll open ugly on Monday, but we might. And if we do open well to the downside, I'm watching that 50 dma level as a possible reversal area.
This week, the Top 50 has increased stock allocations yet again, this time by 5.9% to a total stock allocation of 64.4%.
Here's the charts:


As I mentioned, total stock allocations for this group sit at 64.4% going into the week.


The Total tracker bumped up their stock allocations by 4.68% to a total allocation of 53.32%.

I'm posting the chart of the Wishire 4500 again this week. While the closing price on the S&P 500 has fallen below its 50 dma, the Wilshire 4500 has remained well above it. Last Thursday, this index bounced off support near the 710 level (horizontal blue line) and closed above the lower trend line. Friday, the index fell again, but didn't drop as far as Thursday and closed right at that lower trend line.
While this chart certainly doesn't look ugly at the moment (dicey, but not ugly), price is poised to fall much further given futures fell hard after Friday's close. That doesn't necessarily mean we'll open ugly on Monday, but we might. And if we do open well to the downside, I'm watching that 50 dma level as a possible reversal area.
