Broad-based buying due in part to a weaker dollar pushed the major indices to new highs for 2009. In fact, the S&P 500 settled above the 1100 mark for the first time in more than one year. We jumped the creek today, so-to-speak.
I said the charts were iffy Friday, but that we were at a point in the charts that seemed to suggest a sell-off was coming. Markets do not generally sell-off when traders get leaning too far in one direction and today we saw evidence of that. The latest bloggerpoll has 56% bearish and only 25% bullish. I'll take those numbers any day. And now the bears must be pounding the table. We'd been trading within a 5% range or so for a while now, but the wedge was moving higher in spite of the volatility. We seemed to be at that point again last week, but it was just too obvious this time.
Now that we've established a new high on the S&P (and other indicies) the upside could go further as there is no double-top to worry about now. If sentiment continues to be bearish, and I suspect it will, the downside will be limited once again.
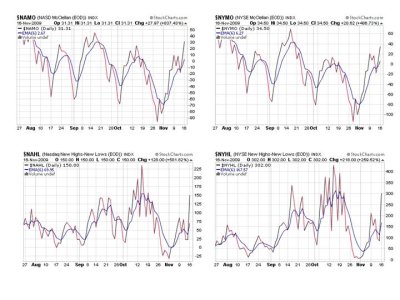
The charts are looking a whole lot better after today too:

Don't these four signals look a lot better? The question in the short term, is how much further can they run?

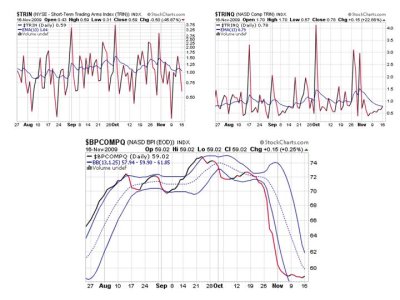
All three of these signals are on a buy too. BPCOMPQ is showing just a tad bit of life after today, but not moving much in any event.
So we have all seven signals back on a buy. But we were already on a buy to begin with, so no real change here. We can sell off again now, just like in previous rallies, but with new highs established, any sell-off will probably be contained. Especially if sentiment continues to support.
I said the charts were iffy Friday, but that we were at a point in the charts that seemed to suggest a sell-off was coming. Markets do not generally sell-off when traders get leaning too far in one direction and today we saw evidence of that. The latest bloggerpoll has 56% bearish and only 25% bullish. I'll take those numbers any day. And now the bears must be pounding the table. We'd been trading within a 5% range or so for a while now, but the wedge was moving higher in spite of the volatility. We seemed to be at that point again last week, but it was just too obvious this time.
Now that we've established a new high on the S&P (and other indicies) the upside could go further as there is no double-top to worry about now. If sentiment continues to be bearish, and I suspect it will, the downside will be limited once again.
The charts are looking a whole lot better after today too:

Don't these four signals look a lot better? The question in the short term, is how much further can they run?

All three of these signals are on a buy too. BPCOMPQ is showing just a tad bit of life after today, but not moving much in any event.
So we have all seven signals back on a buy. But we were already on a buy to begin with, so no real change here. We can sell off again now, just like in previous rallies, but with new highs established, any sell-off will probably be contained. Especially if sentiment continues to support.
