-
The Forum works well on MOBILE devices without an app: Just go to: https://forum.tsptalk.com
-
Please read our AutoTracker policy on the IFT deadline and remaining active. Thanks!
-
$ - Premium Service Content (Info) | AutoTracker Monthly Winners | Is Gmail et al, Blocking Our emails?
Find us on: Facebook & X | Posting Copyrighted Material
-
Join the TSP Talk AutoTracker: How to Get Started | Login | Main AutoTracker Page
You are using an out of date browser. It may not display this or other websites correctly.
You should upgrade or use an alternative browser.
You should upgrade or use an alternative browser.
Bquat's Account Talk
- Thread starter Bquat
- Start date
Bquat
TSP Talk Royalty
- Reaction score
- 815
FogSailing
Market Veteran
- Reaction score
- 61
Hi BQ: No idea what's going to happen. My gut says odds of the tax cut are more probable than a defeat, but with so much turmoil in the Republican party I'm not sure. If the tax cut is passed, the market should rally and then pull back heavily in the not to distant future. If it doesn't crash, I see a pullback heading to 2350 right after the vote before moving on up to new highs. Next 2 weeks will be interesting. Last year, markets were mixed in December despite the trump victory. Remember, 85% of the time the market makes money.
FS
FS

Bquat
TSP Talk Royalty
- Reaction score
- 815
Bquat
TSP Talk Royalty
- Reaction score
- 815
Doing fine near the 60's today.Happy 2018 down there in the warmth! Hope all is well with you and yours!
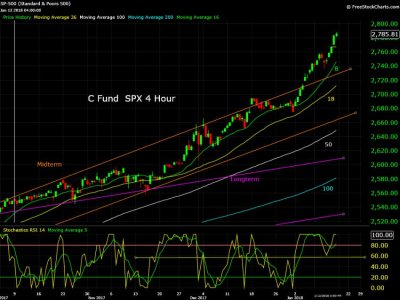
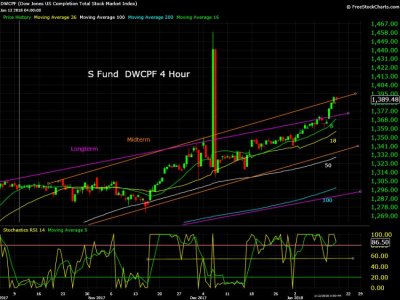
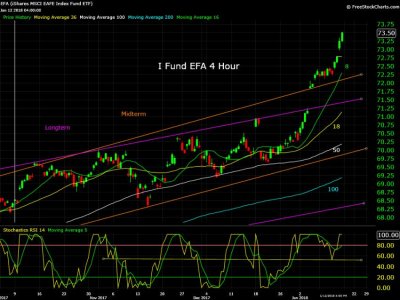
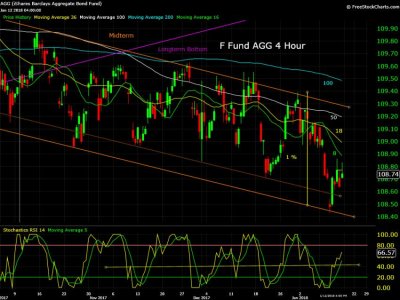
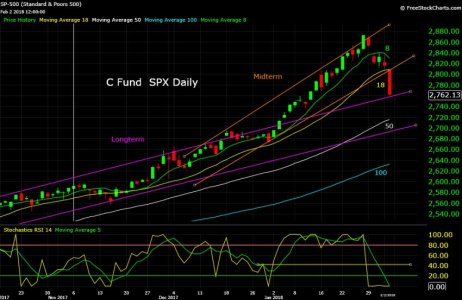
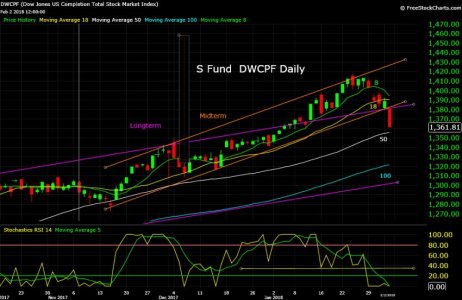
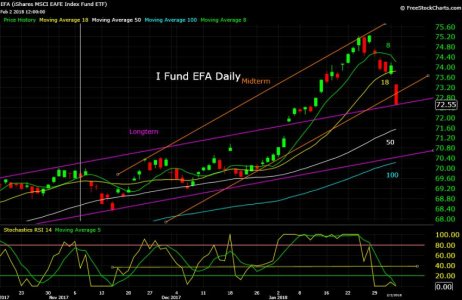
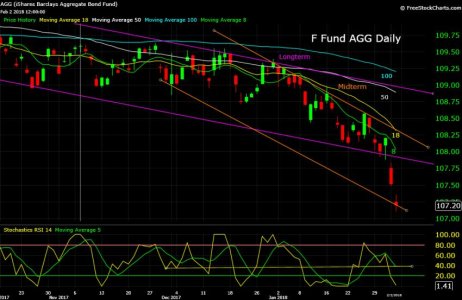
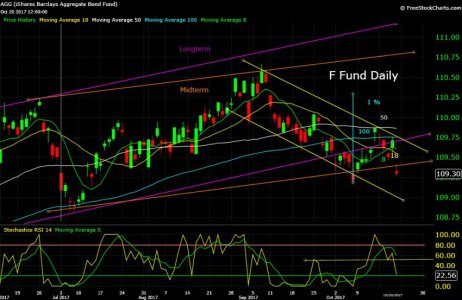
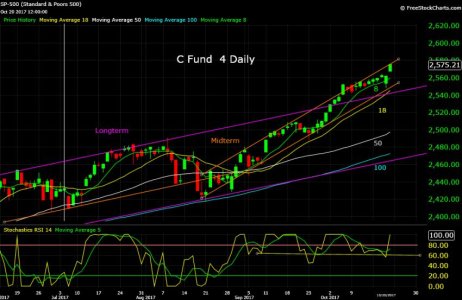
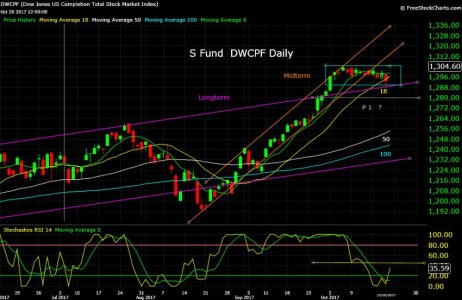
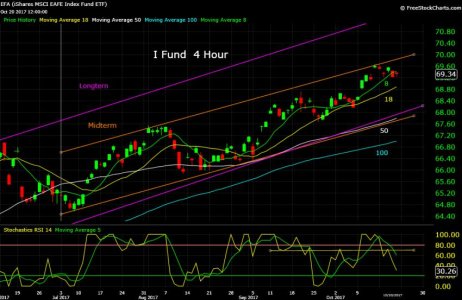
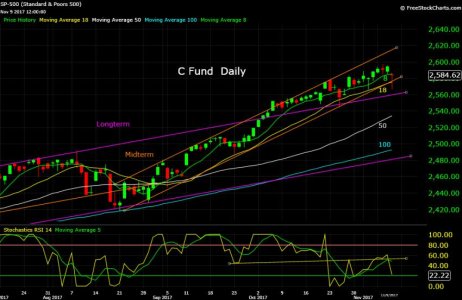
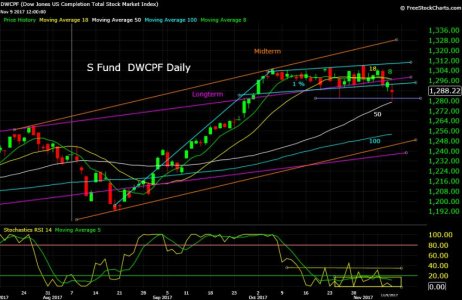
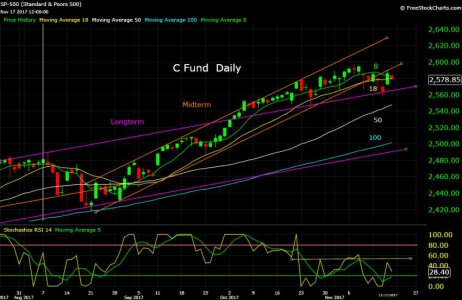
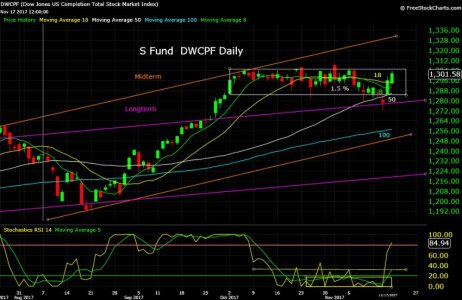
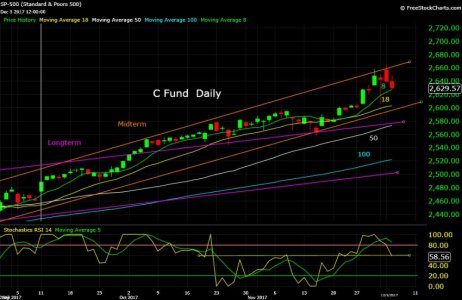
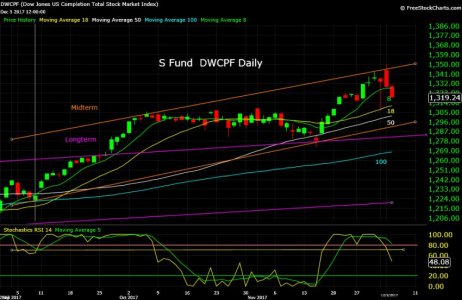
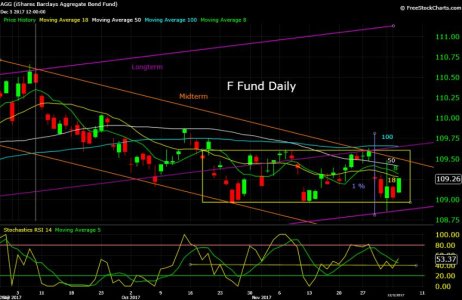
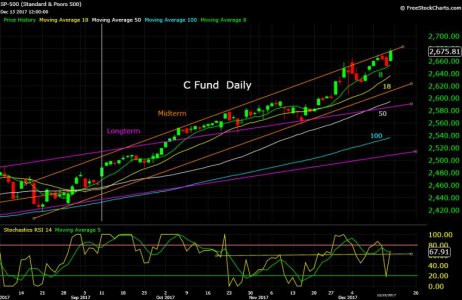
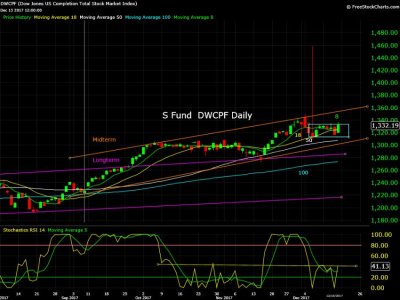
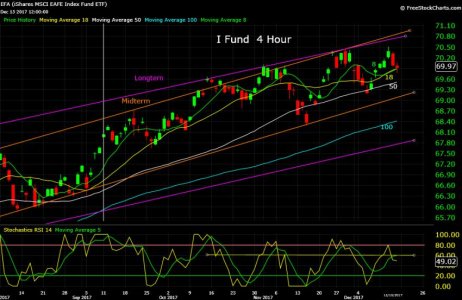
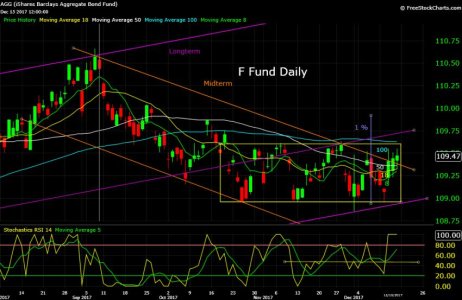
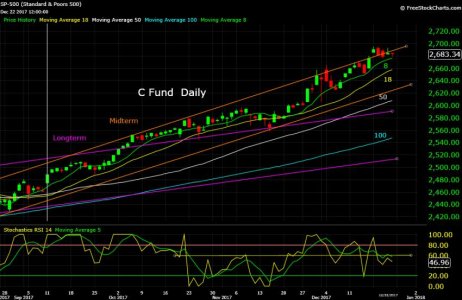
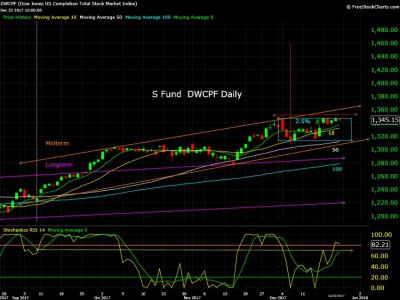
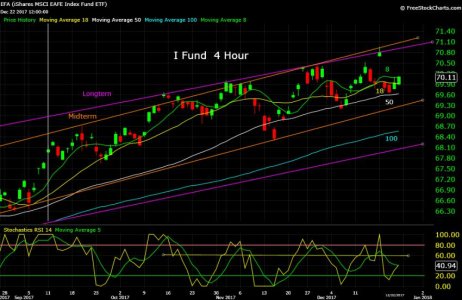
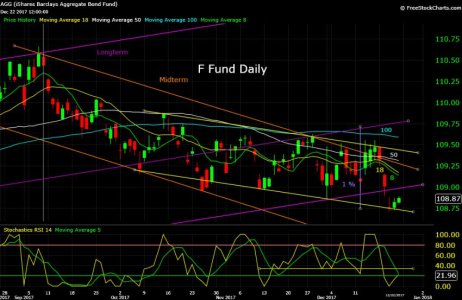
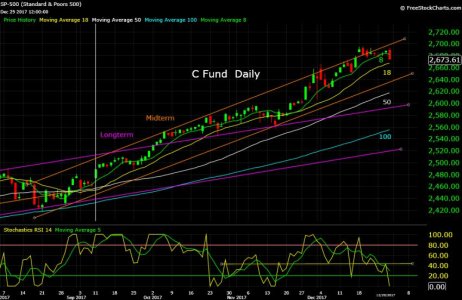
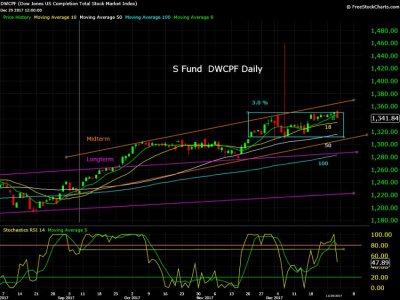
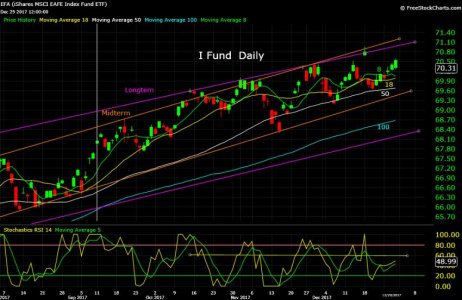
Maybe hit the 50 email, or just below it in C and S?Is the damage done? Daily charts 2/04/18:
Mcqlives
Market Veteran
- Reaction score
- 24
Thanks for the Charts BQUAT! Just a quick post on a IMHO 2cents kind of way. Markets were looking for a reason to pull back. Add the negative comments on valuation several talking heads involved with the Fed were making I'm not surprised we got as much as we did. As of yesterday I had 2560ish on the SnP penciled in as my bail point. I know very few people around here chart the futures but we did hit, and bounce, on that point early this morning.
Some points to consider on the past few days market action:
-It has been talked about for a loooong time so there were a lot of people doing the "sky is falling" thing. I admit, I almost bailed yesterday, along with a bunch of others.
-This sell off happened with volume remaining relatively low
-Economic data (Earnings/employment/gdp/trade policy) almost all remain positive
-Increased production without a parallel in consumption is a concern but when you look at the potential for increased exports through re-negotiated trade agreements that concern is greatly minimized if not negated.
-And, one of my favorite leading indicators (honors to Birch) is the DJT. It hit its high on January 12 and started it's decline on January 22. I thought of bailing early last week but, when I kept making money, got complacent and took the hit on Friday and Yesterday. It hit it's low yesterday (I hope) and started climbing. I will be paying more attention to the DJT in the days to come for sure.
Now that we have some volatility back let's make some $$$$!!!!
Similar threads
- Replies
- 2
- Views
- 697