-
The Forum works well on MOBILE devices without an app: Just go to: https://forum.tsptalk.com
-
Please read our AutoTracker policy on the IFT deadline and remaining active. Thanks!
-
$ - Premium Service Content (Info) | AutoTracker Monthly Winners | Is Gmail et al, Blocking Our emails?
Find us on: Facebook & X | Posting Copyrighted Material
-
Join the TSP Talk AutoTracker: How to Get Started | Login | Main AutoTracker Page
You are using an out of date browser. It may not display this or other websites correctly.
You should upgrade or use an alternative browser.
You should upgrade or use an alternative browser.
Bquat's Account Talk
- Thread starter Bquat
- Start date
Bquat
TSP Talk Royalty
- Reaction score
- 815
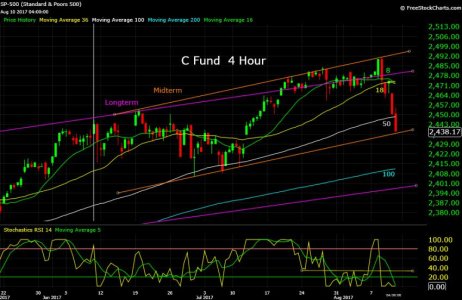
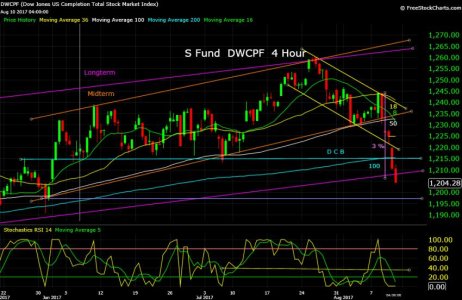
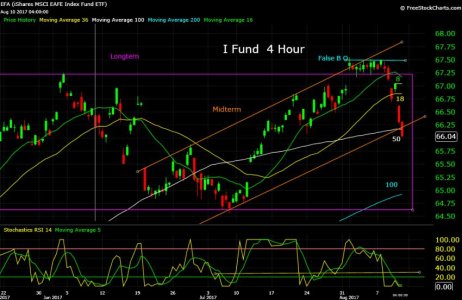
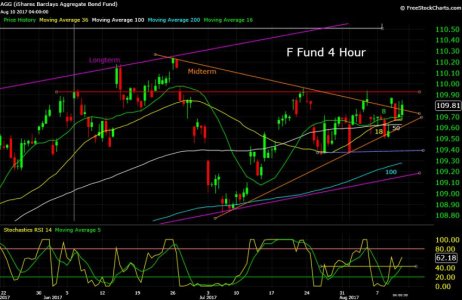
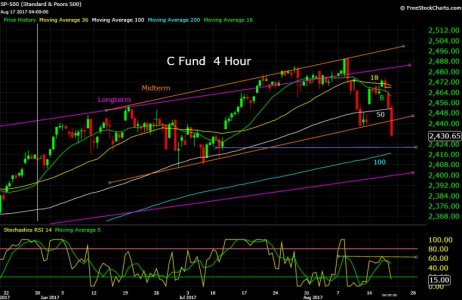
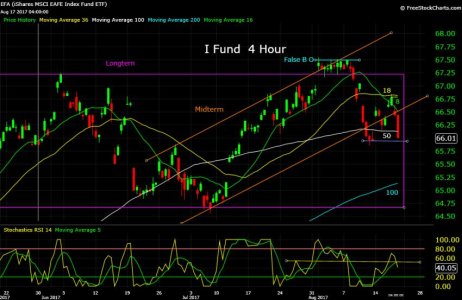
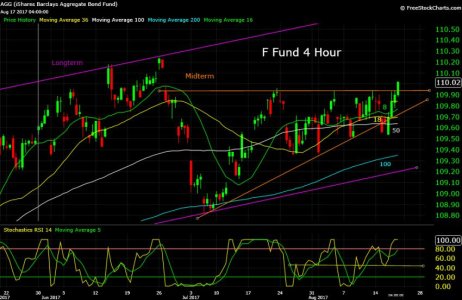
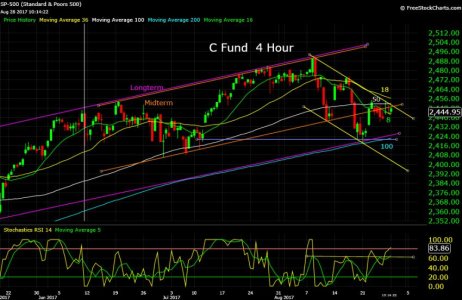
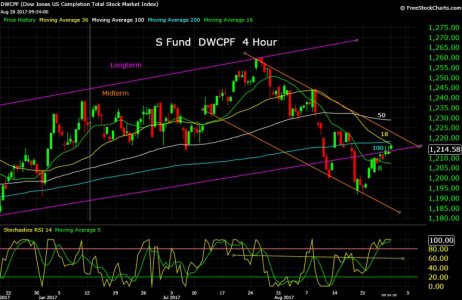
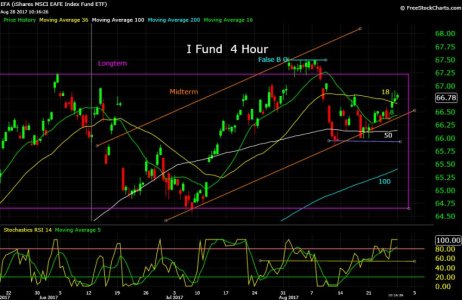
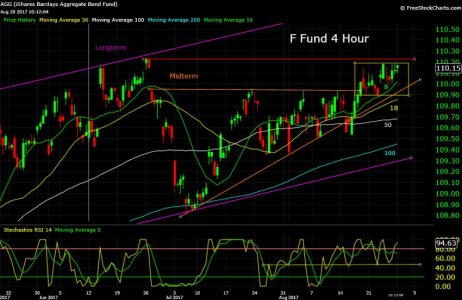
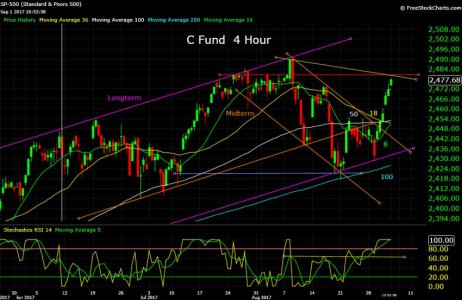
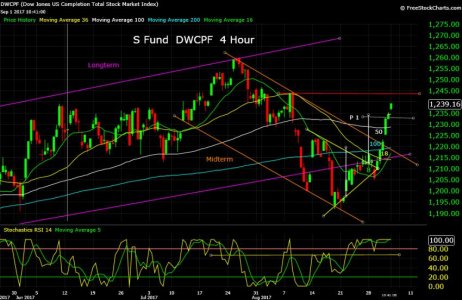
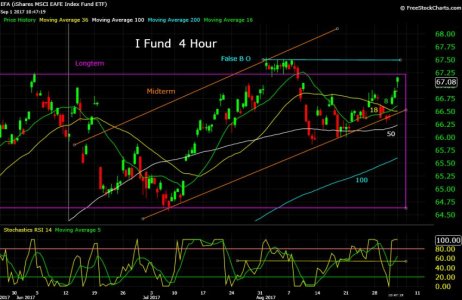
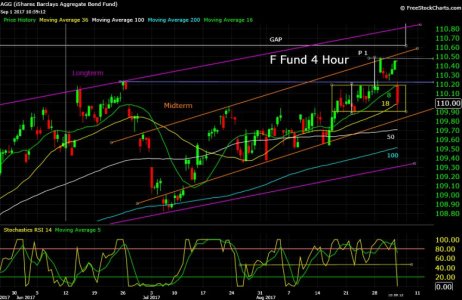
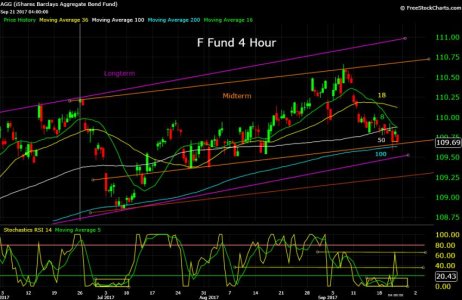
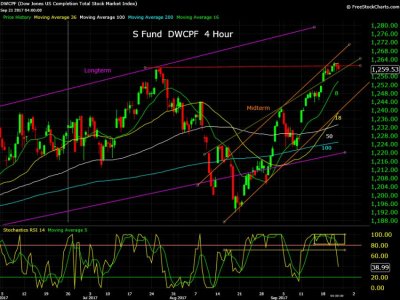
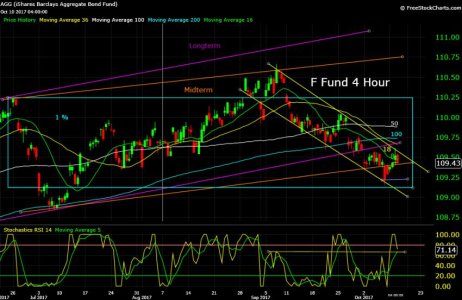
Not seeing Hurricane in Gulf effect on markets yet but it could still happen. Watching moving averages as resistance. Charts 8/28/17:
Attachments
Bquat
TSP Talk Royalty
- Reaction score
- 815
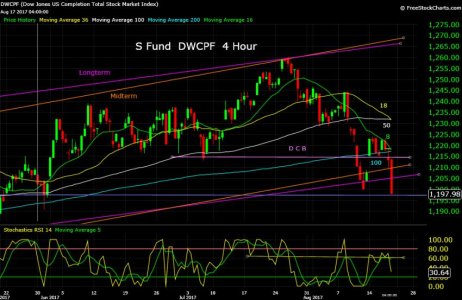
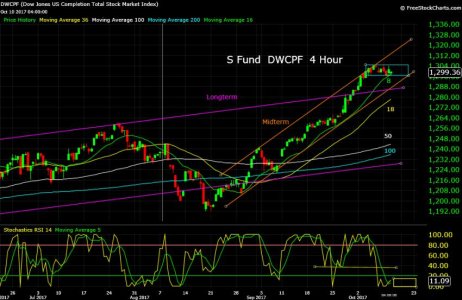
I can't tell. It was looking like a V bottom at first but now looking more like a bear flag as it continues to spread out to the right. At the bottom of the chart I have it dropping into over bought territory. News cycles have more of an effect on the market these days as it can turn so quickly with super computers. No more examples of its like turning a big ship on the movement of big money any more. It's like we're the row boat in a speed boat race. My charting is more like speculation on the odds of a direction.Check out a short term run of the S fund. Sure looks like a wind-up...but for what?!?!?
As always, thanks for the charts and have a great weekend (But just about everyday is a weekend for you, isn't it!)

Bquat
TSP Talk Royalty
- Reaction score
- 815
I'm OK. Just not charting as much.Been 2 weeks without your charting bud...hope all is OK!!!

Mcqlives
Market Veteran
- Reaction score
- 24
The financial market is so news based and so manipulated by big money and super computers that I'm doing too much second guessing in this particular short term.:blink: So September - October neutral.
Yep...when you have computers running algorithms that are trading for marginalized multiple cent profits, 1,000 times per second, for hundreds (1,000's?) of stocks at the same time...the waters sure get muddy!
Quat, I think the computer algorithms have changed...and are now excluding FAKE NEWS, especially the recycled variety like Russians!, NK!, Mueller!, Nuttjob!, tweet! If it isn't either new or true, the computers are excluding it or buying the tiniest dip.The financial market is so news based and so manipulated by big money and super computers that I'm doing too much second guessing in this particular short term.:blink: So September - October neutral.
Sent from my SM-J320P using Tapatalk
Bquat
TSP Talk Royalty
- Reaction score
- 815
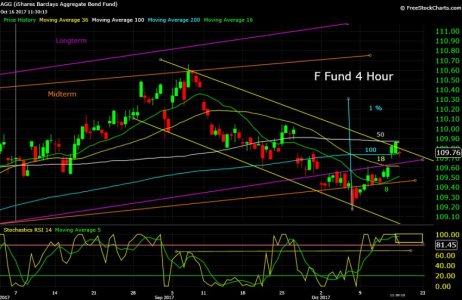
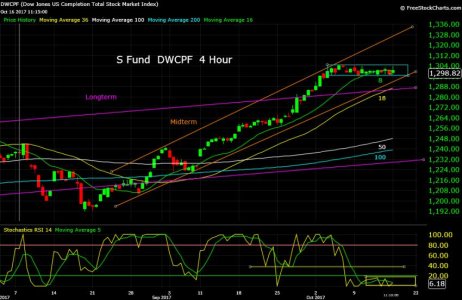
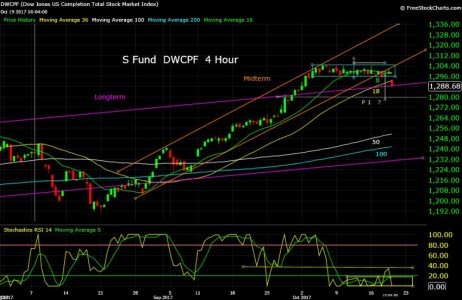
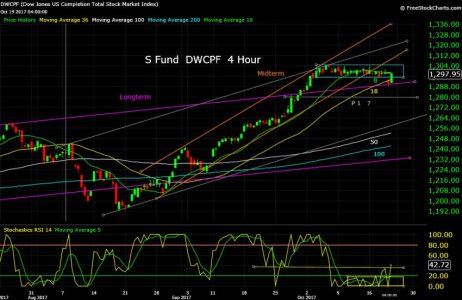
Is a turn coming or what? Charts 10/16/17::suspicious:I just can't appease the Spidey. :suspicious:
Attachments
Bquat
TSP Talk Royalty
- Reaction score
- 815
Keeping an eye on this. Flat tops can cause big drops. Don't make me draw P 2::worried:I just can't appease the Spidey. :suspicious:
Attachments
Mcqlives
Market Veteran
- Reaction score
- 24
Keeping an eye on this. Flat tops can cause big drops. Don't make me draw P 2::worried:
And I don't like this stall at 2555ish on the SnP trying to climb out of this morning drop. Not giving me warm fuzzies!
I think we have to close in the 2556-2560 range to set up buyers for tomorrow.
Bquat
TSP Talk Royalty
- Reaction score
- 815
Boy was I surprised with the dip buy:Keeping an eye on this. Flat tops can cause big drops. Don't make me draw P 2::worried:
Attachments
Similar threads
- Replies
- 2
- Views
- 697