-
The Forum works well on MOBILE devices without an app: Just go to: https://forum.tsptalk.com
-
Please read our AutoTracker policy on the IFT deadline and remaining active. Thanks!
-
$ - Premium Service Content (Info) | AutoTracker Monthly Winners | Is Gmail et al, Blocking Our emails?
Find us on: Facebook & X | Posting Copyrighted Material
-
Join the TSP Talk AutoTracker: How to Get Started | Login | Main AutoTracker Page
You are using an out of date browser. It may not display this or other websites correctly.
You should upgrade or use an alternative browser.
You should upgrade or use an alternative browser.
Bquat's Account Talk
- Thread starter Bquat
- Start date
Bquat
TSP Talk Royalty
- Reaction score
- 815
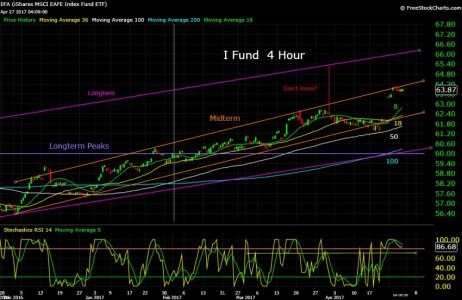
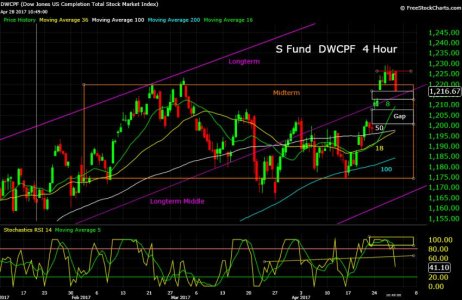
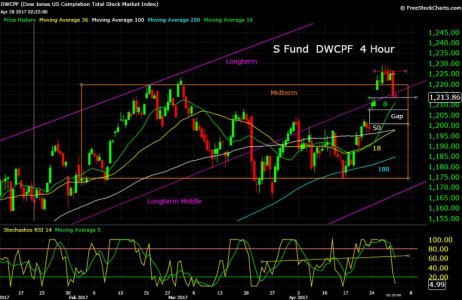
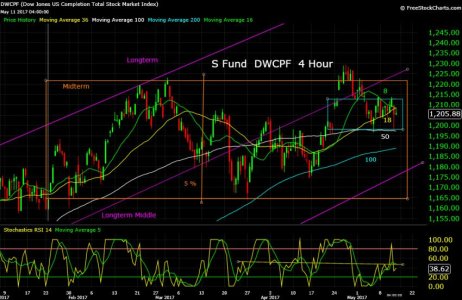
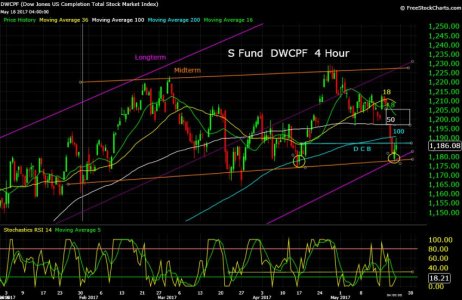
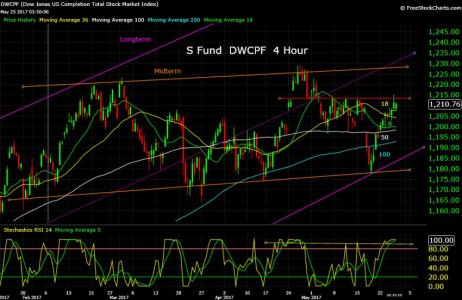
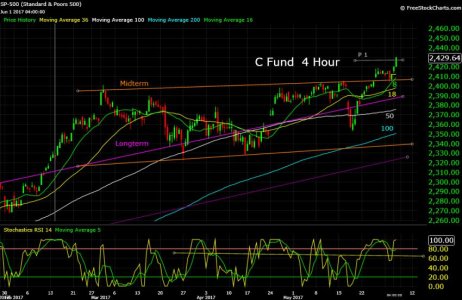
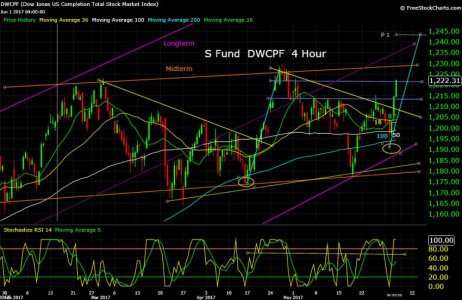
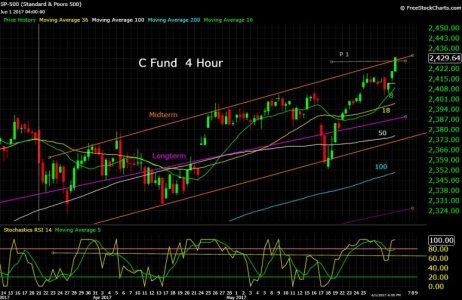
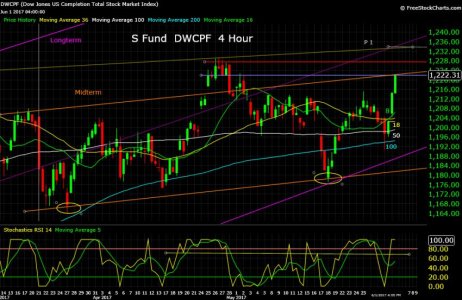
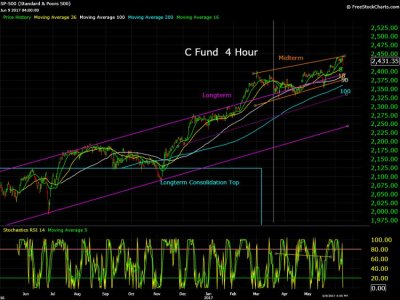
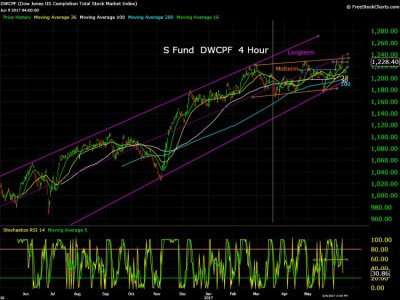
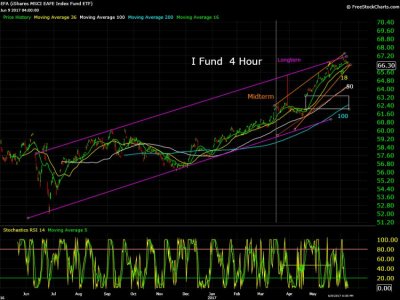
Good question:Is the S Fund breaking out or will it try to fill gaps:
Attachments
Bquat
TSP Talk Royalty
- Reaction score
- 815
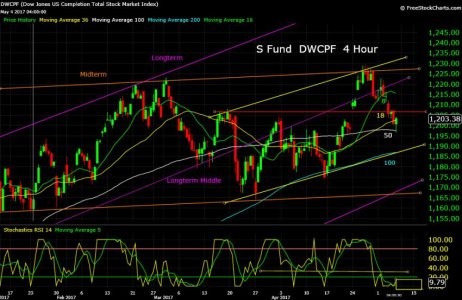
And as resistance::blink:Top of the long term consolidation box tested as support:
Attachments

Bquat
TSP Talk Royalty
- Reaction score
- 815
First gap filled::worried:Is the S Fund breaking out or will it try to fill gaps:
Attachments
Mcqlives
Market Veteran
- Reaction score
- 24
Been a while since I posted, bud. Hope all is well with you and yours.
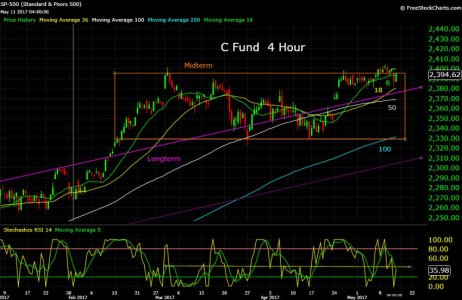
I hope the gaps are considered filled on the S fund and expect it to out-perform the C by quite a bit for the next week or so. If I am wrong then I expect to head for the lily pad for a bit.
I hope the gaps are considered filled on the S fund and expect it to out-perform the C by quite a bit for the next week or so. If I am wrong then I expect to head for the lily pad for a bit.

Bquat
TSP Talk Royalty
- Reaction score
- 815
Bquat
TSP Talk Royalty
- Reaction score
- 815
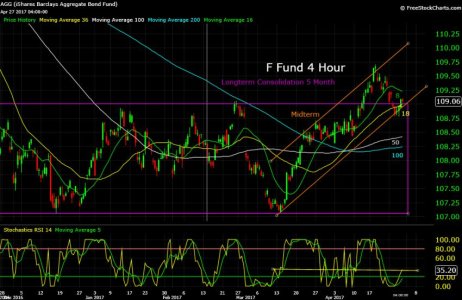
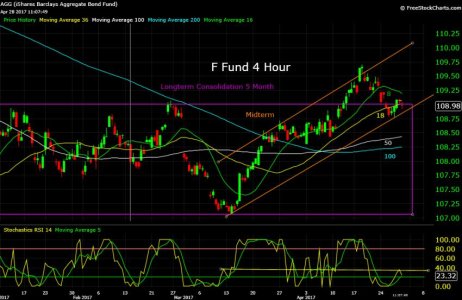
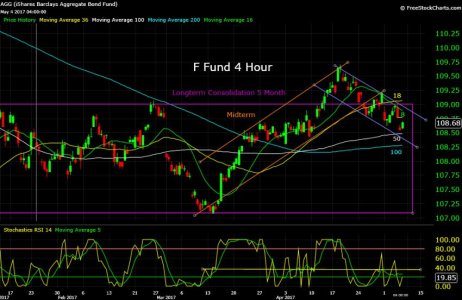
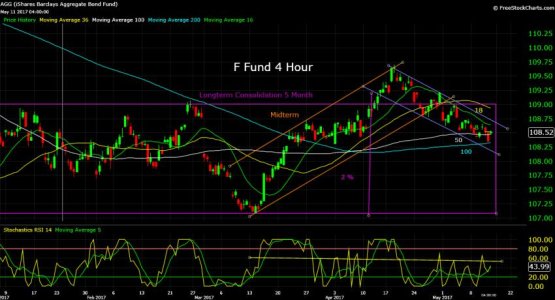
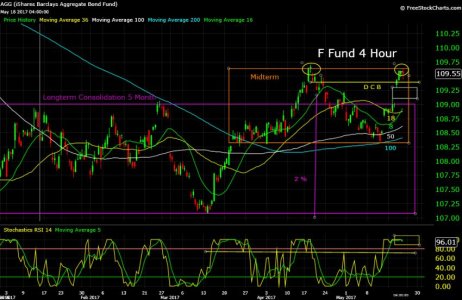
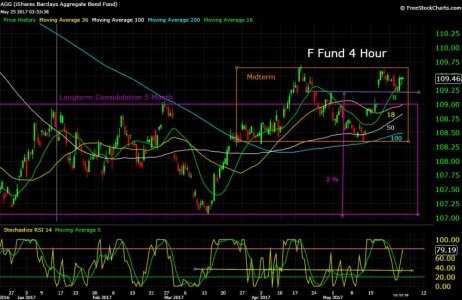
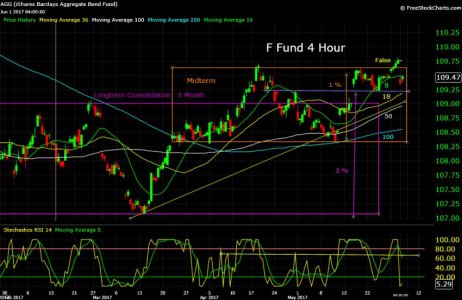
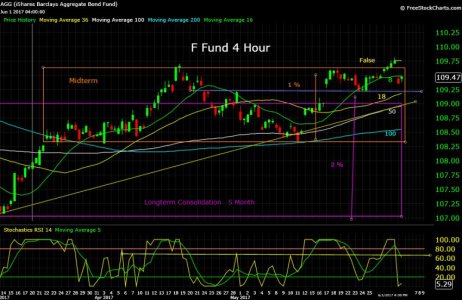
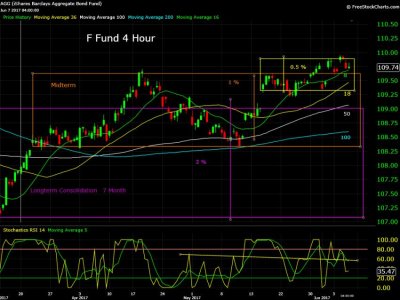
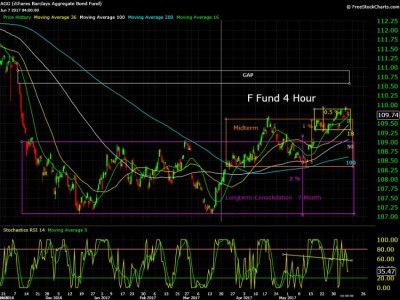
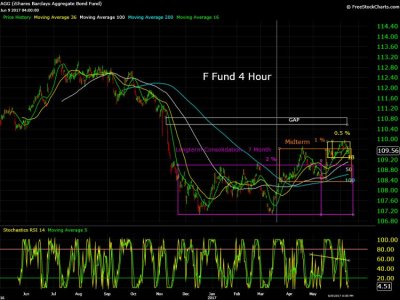
I am surprised that bonds are staying in this low base. The swings went from 2% to 1% and now are only 1/2%. All in all this is 7 months of sideways movement and smaller swings with potential breakouts. What's going to happen? :nuts: AGG:
Attachments
Similar threads
- Replies
- 2
- Views
- 697