-
The Forum works well on MOBILE devices without an app: Just go to: https://forum.tsptalk.com
-
Please read our AutoTracker policy on the IFT deadline and remaining active. Thanks!
-
$ - Premium Service Content (Info) | AutoTracker Monthly Winners | Is Gmail et al, Blocking Our emails?
Find us on: Facebook & X | Posting Copyrighted Material
-
Join the TSP Talk AutoTracker: How to Get Started | Login | Main AutoTracker Page
You are using an out of date browser. It may not display this or other websites correctly.
You should upgrade or use an alternative browser.
You should upgrade or use an alternative browser.
Bquat's Account Talk
- Thread starter Bquat
- Start date
Bquat
TSP Talk Royalty
- Reaction score
- 815
Mcqlives
Market Veteran
- Reaction score
- 24
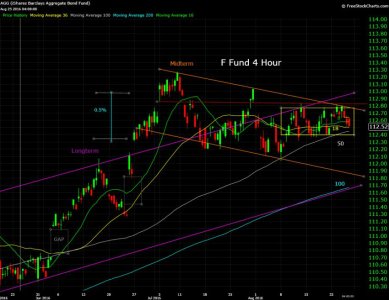
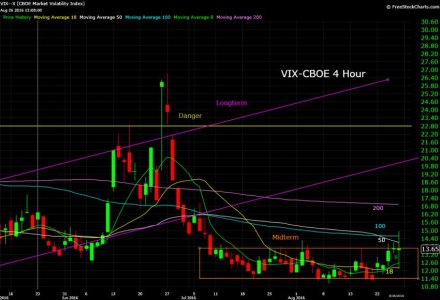
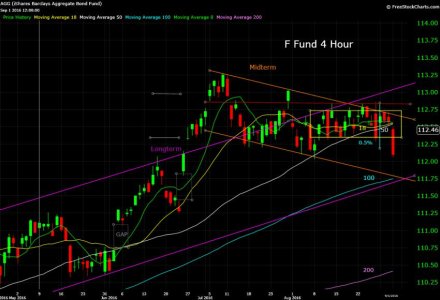
Let's call this riding the F Flag for Friday:
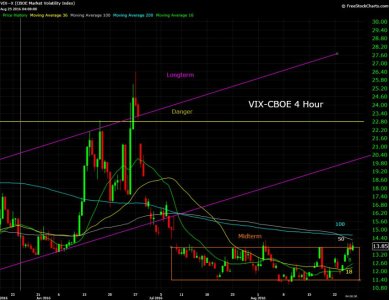
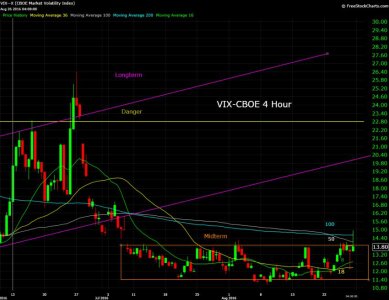
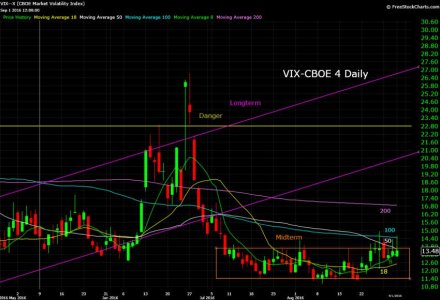
The VIX may finally setting up for some more strength!....nah, who am I kidding, it'll be right back in the box on Monday. HAVE A GREAT WEEKEND!
Bquat
TSP Talk Royalty
- Reaction score
- 815
Yeah. big drop in fear. No make that big pop in fear. No No Never mind:The VIX may finally setting up for some more strength!....nah, who am I kidding, it'll be right back in the box on Monday. HAVE A GREAT WEEKEND!

Attachments
Bquat
TSP Talk Royalty
- Reaction score
- 815
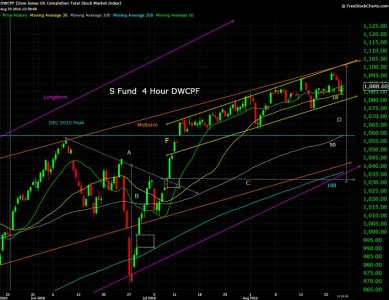
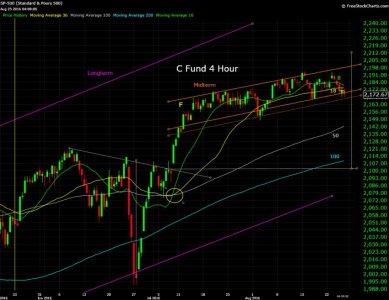
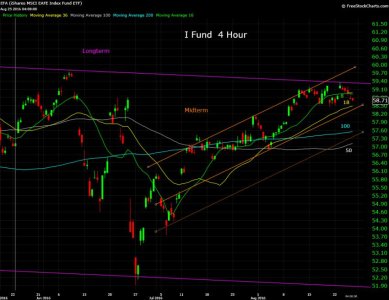
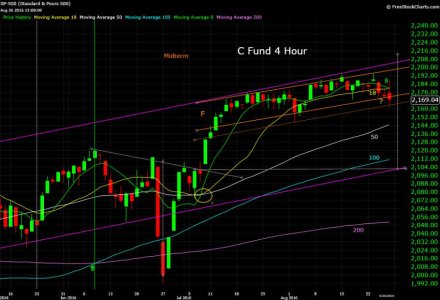
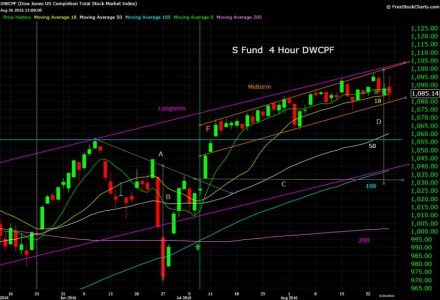
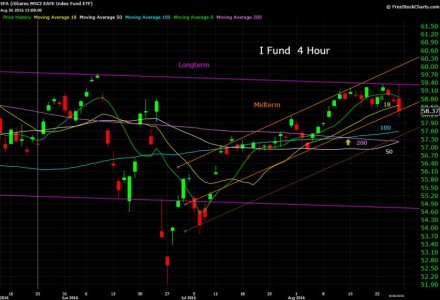
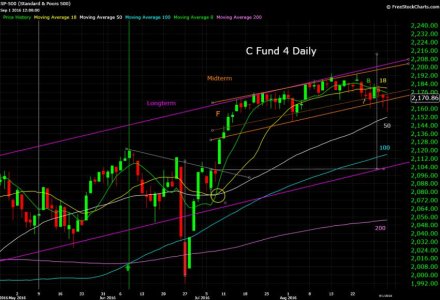
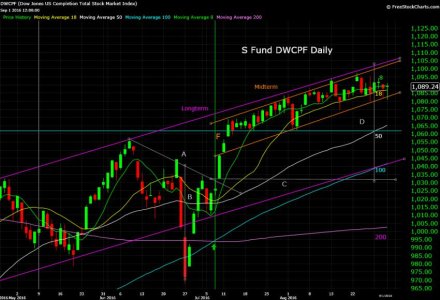
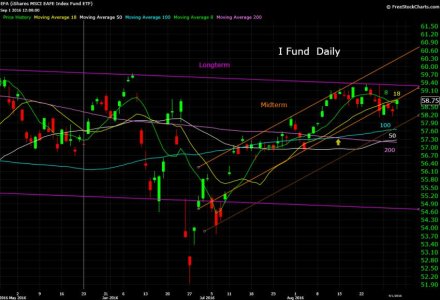
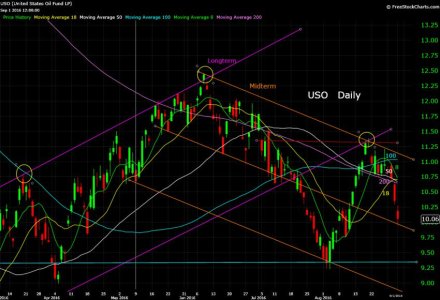
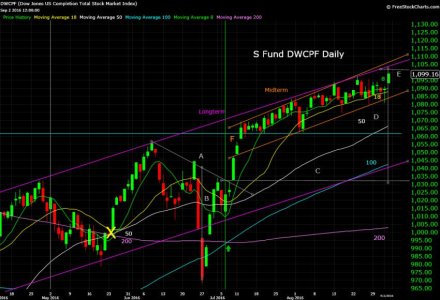
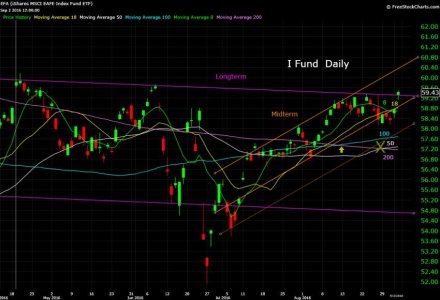
So. since I didn't notice the 100 Day crossing the 200 day I went to the daily time frame.:embarrest: So are the odds more likely that the dips will be bought more than the peaks being sold? Daily Charts of the funds::cheesy:
Attachments
Bquat
TSP Talk Royalty
- Reaction score
- 815
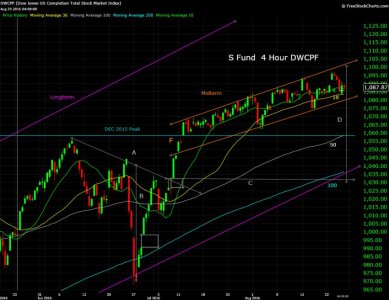
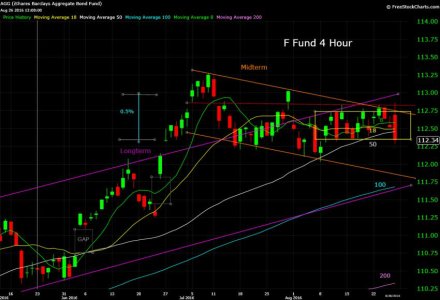
Still following the F Flag:Let's call this riding the F Flag for Friday:
Attachments
FogSailing
Market Veteran
- Reaction score
- 61
I'm nervous BQ; but I have faith in Wall Street that they want to make a lot of money tomorrow and to do that they need to scare the crap out of us dumb money types. Either that or I'm about to lose my shirt...
BTW: Thanks for the charts as always. Always appreciated BQ.
FS
BTW: Thanks for the charts as always. Always appreciated BQ.
FS
DreamboatAnnie
TSP Legend
- Reaction score
- 1,036
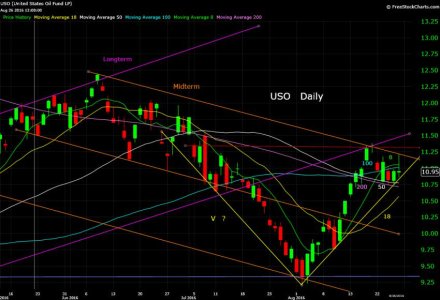
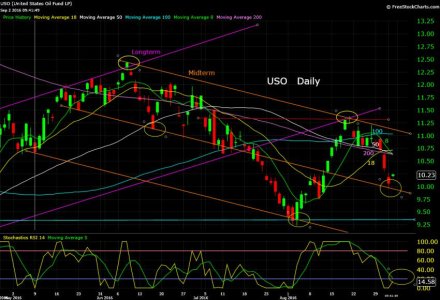
Yep...USO doesn't look so good. I usually do not follow this chart. Out of curiosity I had to check it out using indicators I usually look at. Yuck...
Bquat
TSP Talk Royalty
- Reaction score
- 815
Flip a coin:Just noticed if U SO turns up tomorrow it could be an inverted H&S.
Attachments
Bquat
TSP Talk Royalty
- Reaction score
- 815
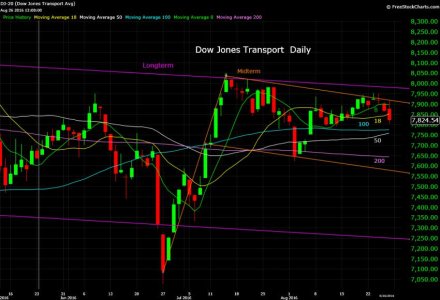
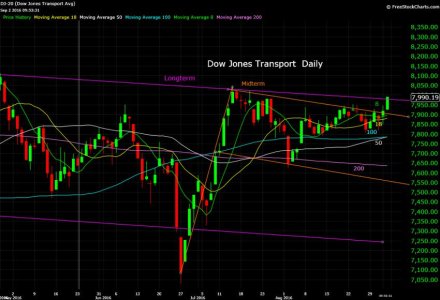
Does look like the weak jobs report is helping it after the breakout of the bull flag but we'll see:yep...i'm continuing to get more nervous. did you see that (almost) 100pt swing on the trans today? If that close was the top then things don't look good for sure. But, as the saying goes, "If is if till it is"...
Attachments
Mcqlives
Market Veteran
- Reaction score
- 24
Does look like the weak jobs report is helping it after the breakout of the bull flag but we'll see:
Thanks, as always, for the chart! It fell right back in the box and closed at 7946. That's above your mid-term but a far cry from the strength we need to get out of this narrow channel. At this rate I am beginning to fall in step with some of those who have posted that nothing is going to happen till after the elections.
 How tight will this crap be coiled by the time that gets here?!?!;swear
Bquat
TSP Talk Royalty
- Reaction score
- 815
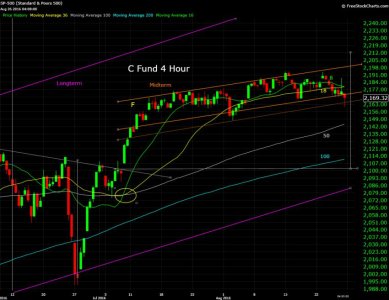
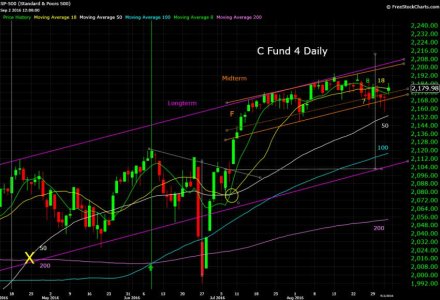
Now that I'm using the daily, I could see some golden crosses starting with the 50 day crossing the 200 day. Usually dips are bought after this occurs. So are things getting better for the longer term? I was reminded of this watching this latest video:
https://www.youtube.com/user/CiovaccoCapital
https://www.youtube.com/user/CiovaccoCapital
Attachments
Similar threads
- Replies
- 2
- Views
- 697