Bquat's Account Talk

I'm on board with the 1450 but I believe it shows up in April. For now a 3-5% pull-back is warranted.
We already had a pull back. I think this is a repeat patterm. Crossing fingers and it is Nnuut's birthday.:) Thinks for your post I get too bullish sometime.
 
Whether you're right or wrong is not important right now. What's important is that you continue your analysis. The more you do this, the better you'll become.
 
Bquat, You do a great job of intraday analysis. Keep up the good work!

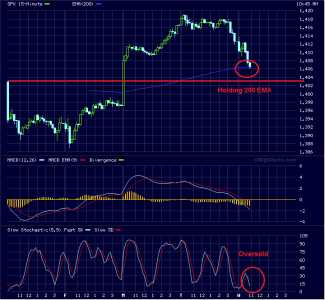
Intra-day analysis is best done with 60 minute, 15 minute and 5 minute charts. Daily charts just dont show you the detail, the elliot waves and the short term candles. Look at this chart for comparison from Bigcharts.com (they are free):


SPX_03_28_12.png
 
Intra-day analysis is best done with 60 minute, 15 minute and 5 minute charts. Daily charts just dont show you the detail, the elliot waves and the short term candles. Look at this chart for comparison from Bigcharts.com (they are free):


View attachment 18347
I'll have to check that out. I been using the 30 min because it gives me a kind of chart to use in a swingtrade type enviroment. We did just get a double bottom in my time frame that will increase my chance of being right. Thinks Uptrend your are one of the people in my desision making process.:D
 
Bquat...A TA question for you... I see the SP putting in place the right shoulder of the inverse HS pattern. If the SP were to continue downward...at what point would the inverse HS pattern be invalid???? Not trying to be bearish just for education purposes!!! Thanks and I look forward to your daily post and the TA analysis!!!
 
Bquat...A TA question for you... I see the SP putting in place the right shoulder of the inverse HS pattern. If the SP were to continue downward...at what point would the inverse HS pattern be invalid???? Not trying to be bearish just for education purposes!!! Thanks and I look forward to your daily post and the TA analysis!!!
I don't know for sure, but I think if the overall trend is up, if the right shoulder gets below the lower left shoulder it might not happen. It may be if you set a lower low that the head. I'm happier if the shoulders are parallel with the base line but they don't have to be.
 
Well I guess by my current discription, we're comming to the last chance now. As always right after IFT deadline.:worried:
 
Lower part of the orange channel holding nicely, now if we can just get back to the upper part. I'd take a run to the new green line but I want to keep strengthening the channel and bust through that pesky red line. Presently The moving averages are all catching up to each other which is something to keep an eye on.
 
Lower part of the orange channel holding nicely, now if we can just get back to the upper part. I'd take a run to the new green line but I want to keep strengthening the channel and bust through that pesky red line. Presently The moving averages are all catching up to each other which is something to keep an eye on.
I think the 13 day blocked it. Squaring up the baseline with the shoulders, I get projected 1438. that's above the red line.:)Hope we don't have to test the head first.
 
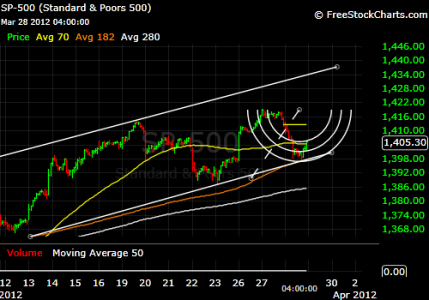
Bquat for all you do for us, I figured I would try my non-existent chart skills and use a half pipe (fib arc...yeah cause I know what that is/means) to produce a beautiful chart. Let me know how much you love it. :D

:laugh:
test.png

With that being said...tomorrow better be an up day or my sweet white line at the bottom won't hold and we are doomed.

Technical analysis...provided by yours truly...

Thank you ladies and gents. I think I'm tired and need to go to bed now. Good night!
 
Nice chart, MaStA! I too am looking for the same outcome as you. The S&P daily chart is putting in a nice "W", and the second leg up should start any day now. Knock on wood.
 
Bquat for all you do for us, I figured I would try my non-existent chart skills and use a half pipe (fib arc...yeah cause I know what that is/means) to produce a beautiful chart. Let me know how much you love it. :D

:laugh:
View attachment 18365Very nice.
With that being said...tomorrow better be an up day or my sweet white line at the bottom won't hold and we are doomed.

Technical analysis...provided by yours truly...

Thank you ladies and gents. I think I'm tired and need to go to bed now. Good night!
The more people that chart helps us see the bigger picture. Even though the charts are basically the same, people add there little bias buy the way they draw there lines. Bearish people draw more resistance lines where they may short and bullish people draw more support lines where they may enter. More opinions make better decisions. Each person can't see it all.

What does the half pipe mean? I'm not familar with it.
 
Well we're in a head test and the bottom of the channel held twice so far.:worried: We need to head up and I would like 1.25% up to show strength and get us moving but more than likely I won't get my wish. I drew the head line for the head test. Cross fingers. May take some loss.:(
 
Back
Top