-
The Forum works well on MOBILE devices without an app: Just go to: https://forum.tsptalk.com
-
Please read our AutoTracker policy on the IFT deadline and remaining active. Thanks!
-
$ - Premium Service Content (Info) | AutoTracker Monthly Winners | Is Gmail et al, Blocking Our emails?
Find us on: Facebook & X | Posting Copyrighted Material
-
Join the TSP Talk AutoTracker: How to Get Started | Login | Main AutoTracker Page
You are using an out of date browser. It may not display this or other websites correctly.
You should upgrade or use an alternative browser.
You should upgrade or use an alternative browser.
Bquat's Account Talk
- Thread starter Bquat
- Start date
Bquat
TSP Talk Royalty
- Reaction score
- 794
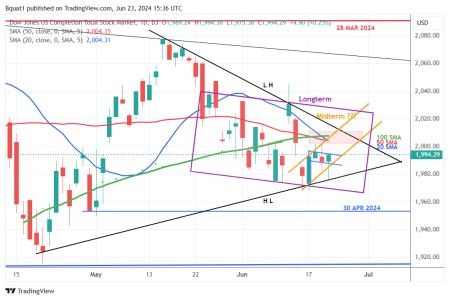
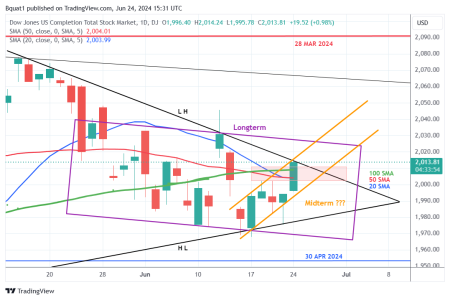
Bull Flag was good. Best thing is the move up without a gap to fill. Chart:I don't know but can this be a slightly tilted consolidation. I can't figure the news. Chart: :suspicious:
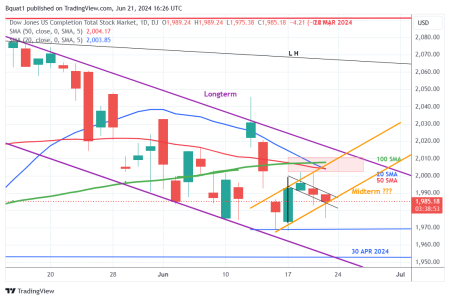
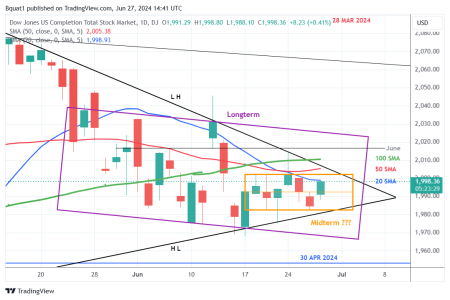
Need something soon to stop the downwards convergence (Pink Rectangle). :worried:

Attachments
- Reaction score
- 2,833
A small Bull Flag is forming.
That flag worked. :fing02:
Bquat
TSP Talk Royalty
- Reaction score
- 794
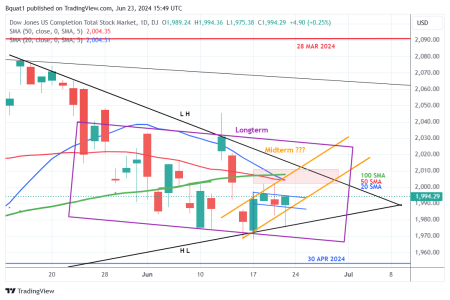
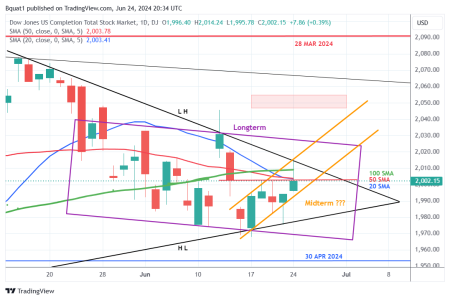
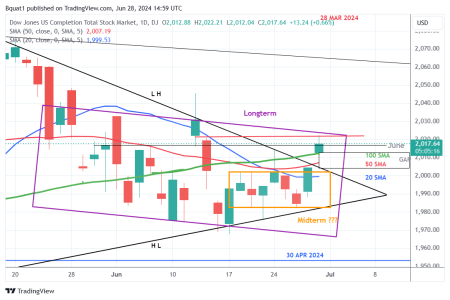
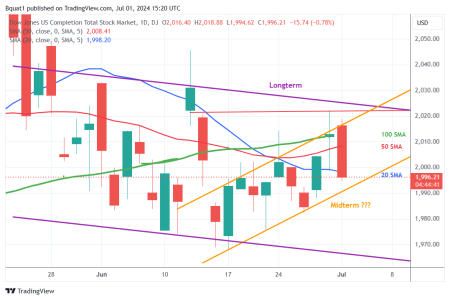
Yes gap is filled. Maybe this isn't weakness but a sideways consolidation to build strength. Chart:Yeah, not a great close, but there is a small open gap that may need filling.
Attachments
Bquat
TSP Talk Royalty
- Reaction score
- 794
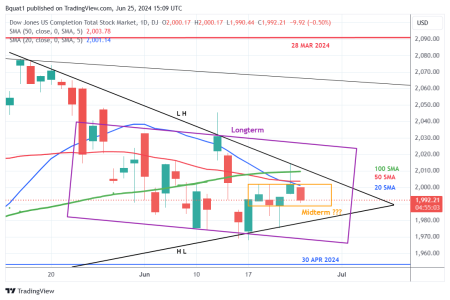
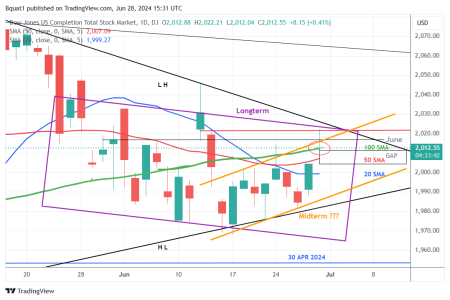
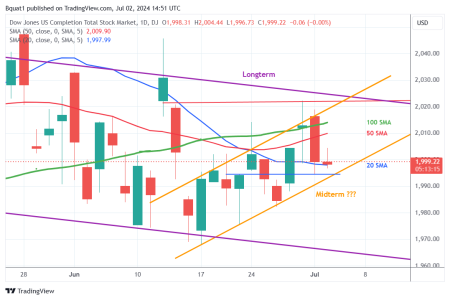
Theoretically my theory is weak. Redrew Midterm slightly. Chart: :blink:Yes gap is filled. Maybe this isn't weakness but a sideways consolidation to build strength. Chart:
Attachments
Bquat
TSP Talk Royalty
- Reaction score
- 794
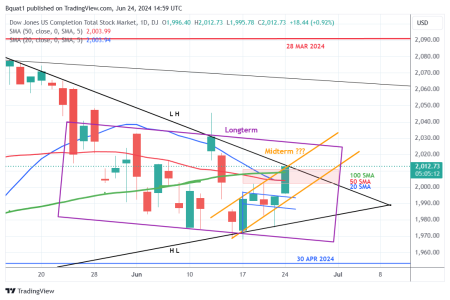
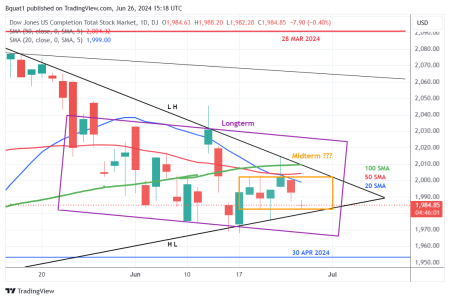
Sideways consolidation continuing, Chart:Theoretically my theory is weak. Redrew Midterm slightly. Chart: :blink:
Attachments
Bquat
TSP Talk Royalty
- Reaction score
- 794
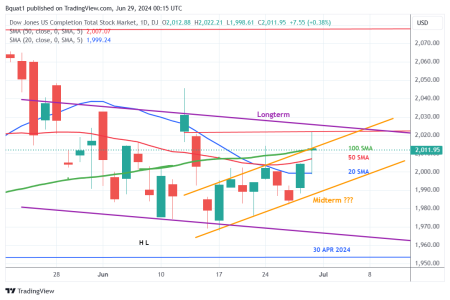
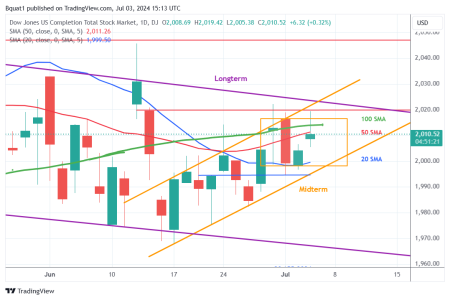
Yep gap is really filled. Hope we are finding support. Chart: :worried:Beleve it or not gap was filled. July Chart:
Attachments
- Reaction score
- 2,833
It was looking more promising this morning but selling off. Moved red resistance line down a little to show top tails. Only good news is no gap to fill. Might develop a shorter sideways Midterm:
Hopefully it is just filling the gap.
How come your chart shows the June 12 candlestick as positive - which to me means it closed near 2030. Mine shows it as negative with a close closer to 2020?

I like yours better because it means there's a gap open near 2030.
")
Similar threads
- Replies
- 2
- Views
- 666