-
The Forum works well on MOBILE devices without an app: Just go to: https://forum.tsptalk.com
-
Please read our AutoTracker policy on the IFT deadline and remaining active. Thanks!
-
$ - Premium Service Content (Info) | AutoTracker Monthly Winners | Is Gmail et al, Blocking Our emails?
Find us on: Facebook & X | Posting Copyrighted Material
-
Join the TSP Talk AutoTracker: How to Get Started | Login | Main AutoTracker Page
You are using an out of date browser. It may not display this or other websites correctly.
You should upgrade or use an alternative browser.
You should upgrade or use an alternative browser.
Bquat's Account Talk
- Thread starter Bquat
- Start date
- Reaction score
- 823
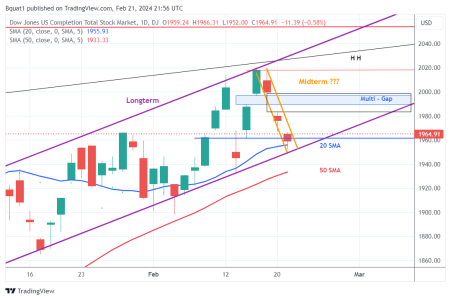
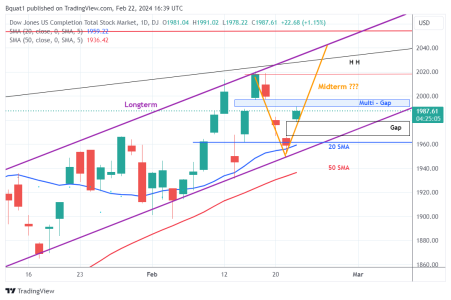
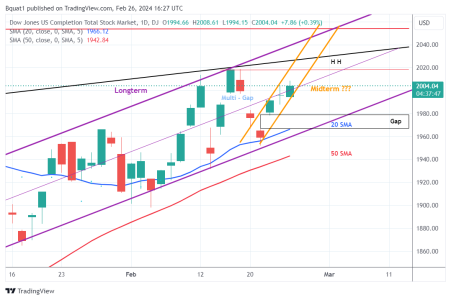
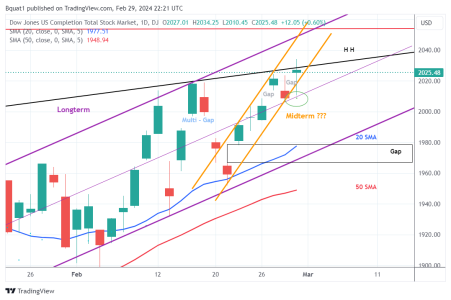
So which way do we go? It looks like we just touched the bottom of the Multi-Gap and we still have the gap below todays run up. This week is set up just like the week of the MLK holiday. Five out of seven Fridays have been green.
Bquat
TSP Talk Royalty
- Reaction score
- 720
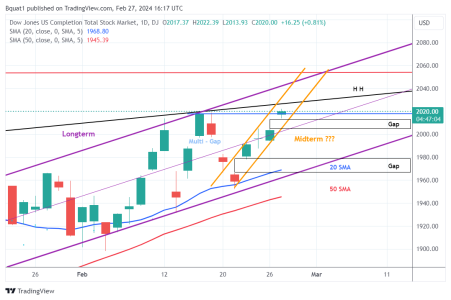
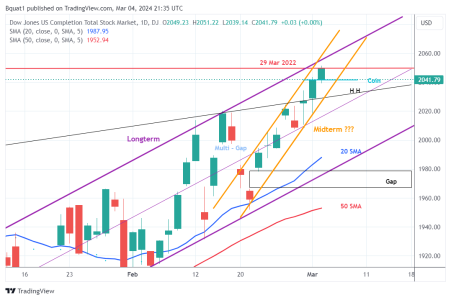
Well my Midterm Channel still seems to be going upwards. I am concerned that we are getting topping tails especially as we are at the Higher High line. I didn't put a gap because of the previous top tail covered this area. Trying to find support. Chart:
Attachments
Bquat
TSP Talk Royalty
- Reaction score
- 720
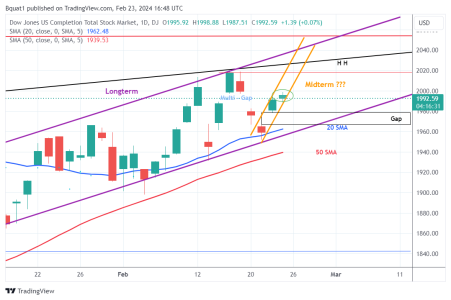
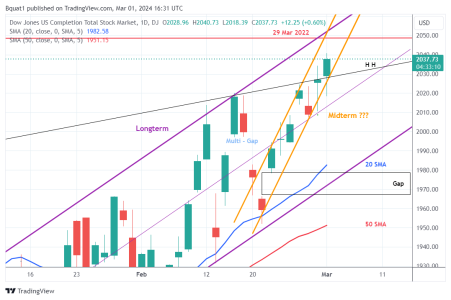
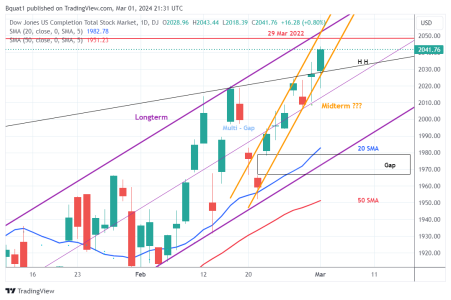
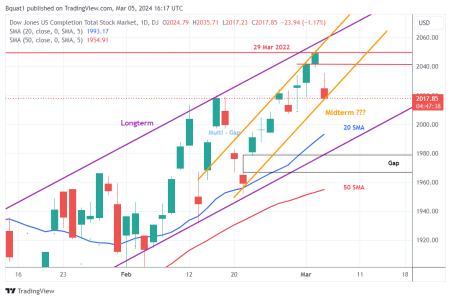
Wow, even I am surprised with the power of today's move. Staying near the new high into today's close. Yes March. Well now I have to wait a few market days to draw a March chart.Well, breakout above the Higher High line and showing more strength. Chart: :smile:
Attachments
Bquat
TSP Talk Royalty
- Reaction score
- 720
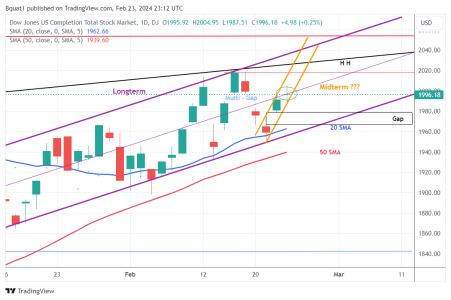
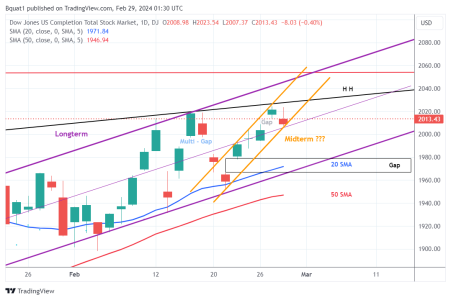
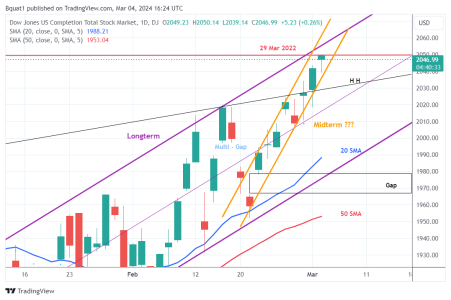
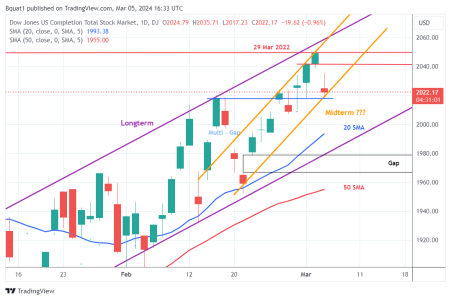
Well, found out Friday's strength was news related about possible rate cut. I am excited about today's bottom tail as we test a shoulder resistance level. Chart:Wow, even I am surprised with the power of today's move. Staying near the new high into today's close. Yes March. Well now I have to wait a few market days to draw a March chart.
Attachments
FAAM
TSP Strategist
- Reaction score
- 117
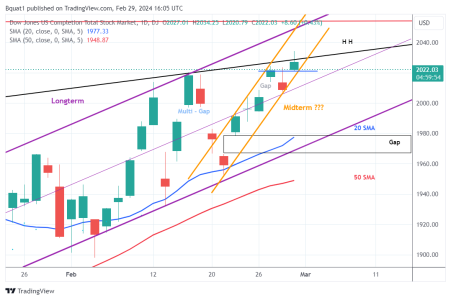
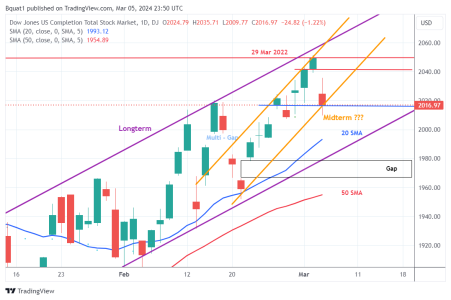
FWIW - Tom has a line on his $DWCPF chart from DEC'23 highs across mid-FEB highs that at this point is roughly 2030: today's market blew down below that then roaded up to 2030 & now back down in 2020 area. Seems to me to give that line validity but has gone from possible support to proven resistance.
I'm no high-roller; was majority in G-fund until I moved to majority mix of CSI late last week, & not feeling too comphy. Almost bailed out today, yet was iffy on being able to get the IFT in oin time, and decided, reading here & Tom's Daily and others - to stick it out for now - and hope. :worried:
I'm no high-roller; was majority in G-fund until I moved to majority mix of CSI late last week, & not feeling too comphy. Almost bailed out today, yet was iffy on being able to get the IFT in oin time, and decided, reading here & Tom's Daily and others - to stick it out for now - and hope. :worried:
Similar threads
- Replies
- 2
- Views
- 539
- Replies
- 2
- Views
- 536
- Replies
- 2
- Views
- 825

