Bquat
TSP Talk Royalty
- Reaction score
- 803
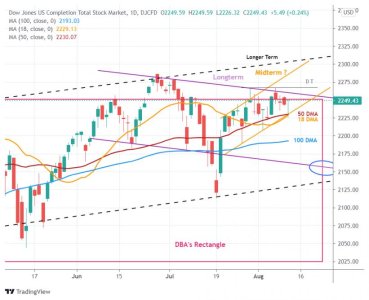
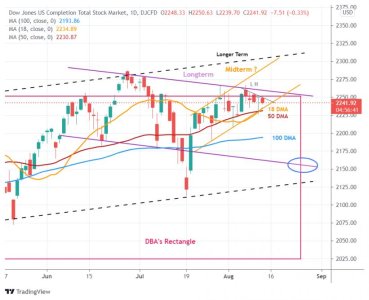
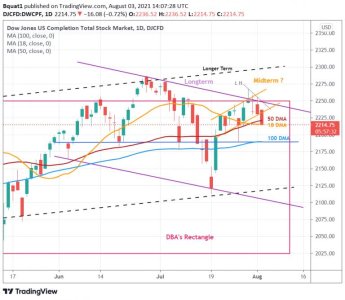
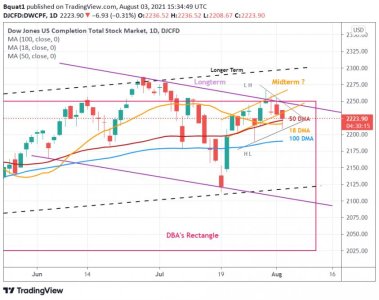
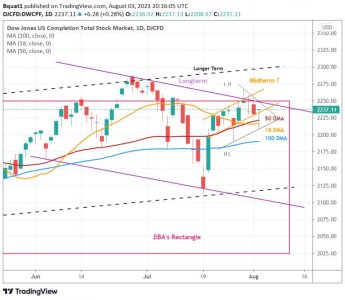
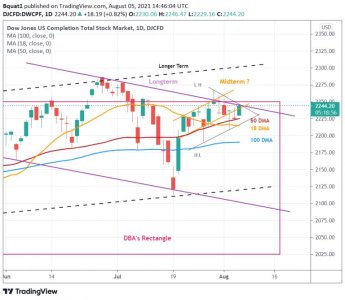
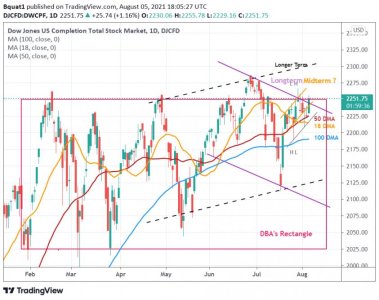
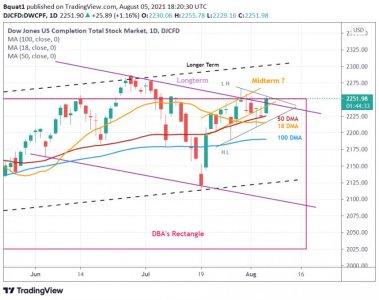
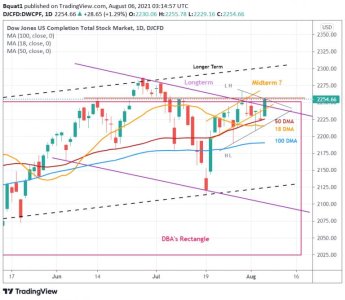
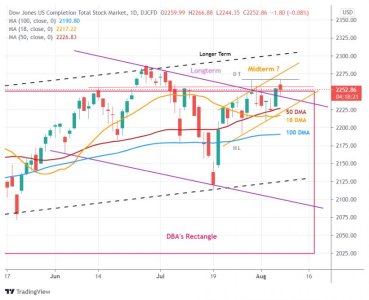
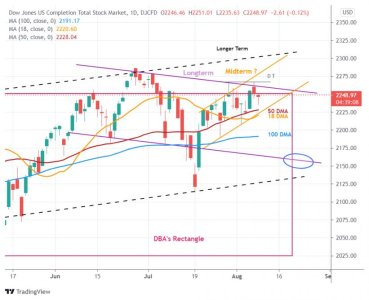
Lower highs and higher lows can be a continuation pattern. We may be in a down trend and if you feed the fish it might go down to the bottom to feed. 60/40 this can break downward to purple line. Just a guess on my part but I have been too bearish lately::cheesy:Not quite sure the meaning of that?


 *
*