Bquat
TSP Talk Royalty
- Reaction score
- 803
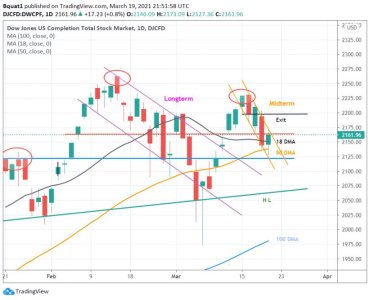
I think my line was good:Looks like the S-train blew through your resistance line and is already at, or past, your exit... =:-o

The Forum works well on MOBILE devices without an app: Just go to: https://forum.tsptalk.com
Please read our AutoTracker policy on the
IFT deadline and remaining active. Thanks!
$ - Premium Service Content (Info) | AutoTracker Monthly Winners | Is Gmail et al, Blocking Our emails?
Find us on: Facebook & X | Posting Copyrighted Material
Join the TSP Talk AutoTracker: How to Get Started | Login | Main AutoTracker Page
I think my line was good:Looks like the S-train blew through your resistance line and is already at, or past, your exit... =:-o
Still good:I think my line was good:
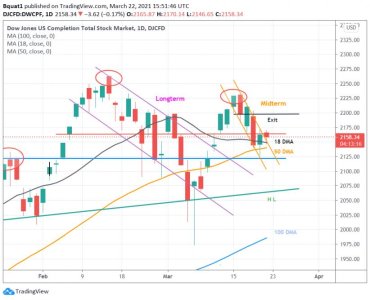
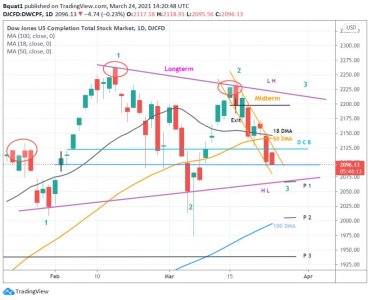
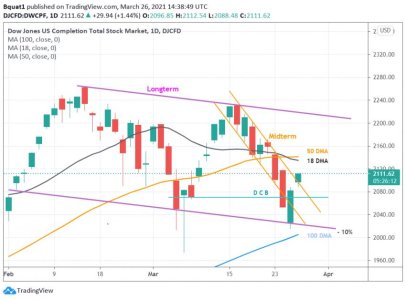
 The slow drop of the right shoulder shows P1 and P2 both have good chances of holding unless selling picks up:
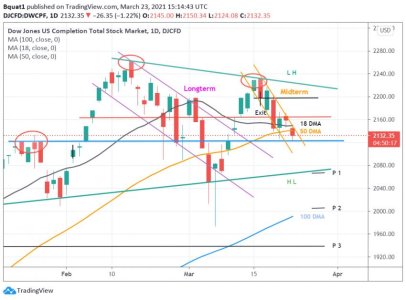
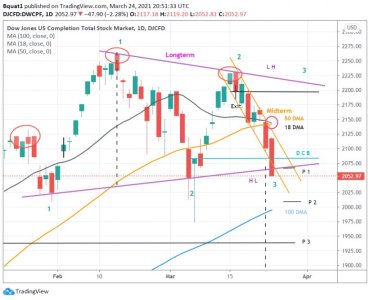
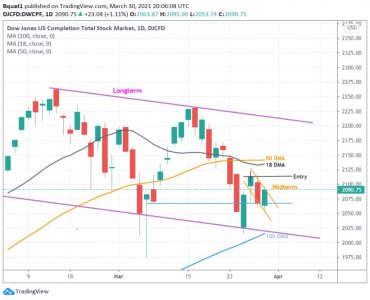
Selling is starting to pick up. Watching to see if P1 holds to keep within symmetrical triangle (LH / HL) pattern going otherwise P2 or P3 still possible::worried:Little redraw of Midterm channel, Bad news is that we broke below the 50 Day.:worried: Testing left shoulder level as support. P1 is where the right shoulder should complete. P2 is 100 Day test and P3 is projected H&S loss.
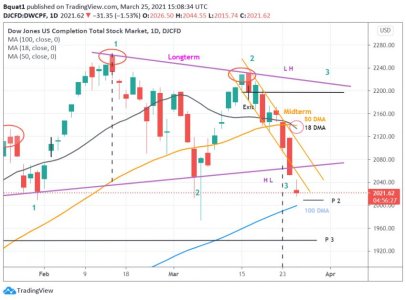
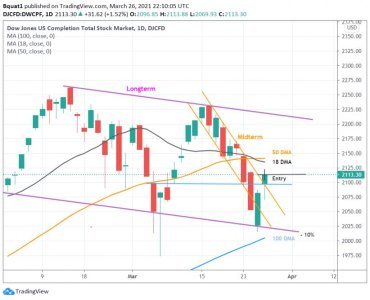
The selling is accelerating.Little redraw of Midterm channel, Bad news is that we broke below the 50 Day.:worried: Testing left shoulder level as support. P1 is where the right shoulder should complete. P2 is 100 Day test and P3 is projected H&S loss.
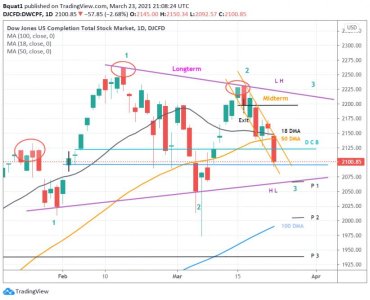
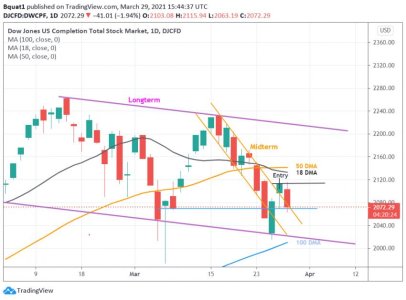
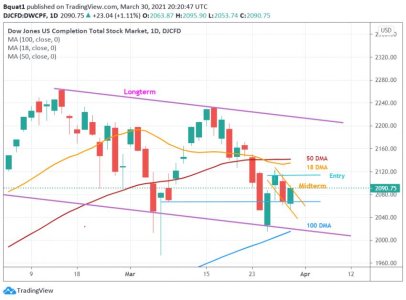
We need to turn up tomorrow to keep the symmetrical triangle to be in force. P1 was missed and P2 is -10% from peak. There is a slight chance of filling an old gap below P3 (dotted shadow line):
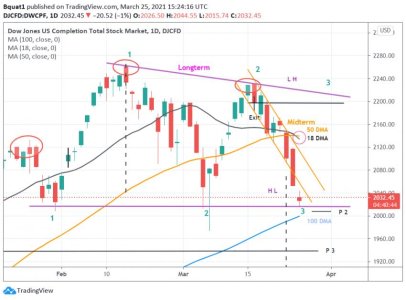
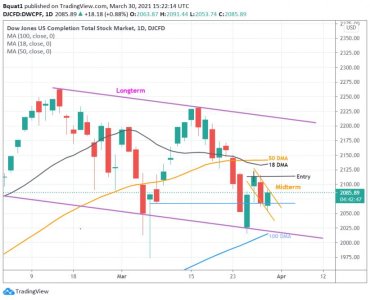
The bad and the ugly. We can forget my symmetrical triangle which is a continuation pattern (uptrend). We are over sold but can embed to the downside today. My 18 Day has crossed my 50 Day. We are close enough to the -10 percent correction but the buying after today's drop was rejected:The selling is accelerating.