flalaw97
TSP Strategist
- Reaction score
- 13
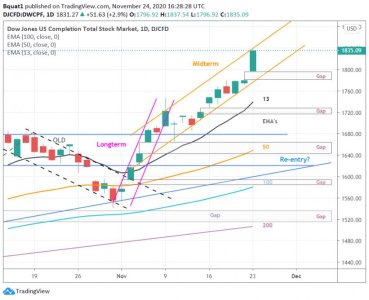
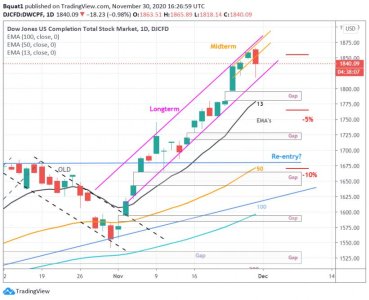
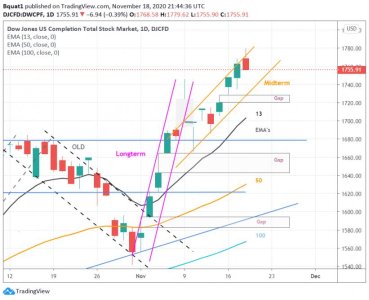
Some post vaccine news weakness. So maybe another over reaction::worried:
And then four hours later rocket upward movement!? This is absolutely crazy. Thanks for plugging away at the charts!
The Forum works well on MOBILE devices without an app: Just go to: https://forum.tsptalk.com
Please read our AutoTracker policy on the
IFT deadline and remaining active. Thanks!
$ - Premium Service Content (Info) | AutoTracker Monthly Winners | Is Gmail et al, Blocking Our emails?
Find us on: Facebook & X | Posting Copyrighted Material
Join the TSP Talk AutoTracker: How to Get Started | Login | Main AutoTracker Page
Some post vaccine news weakness. So maybe another over reaction::worried:
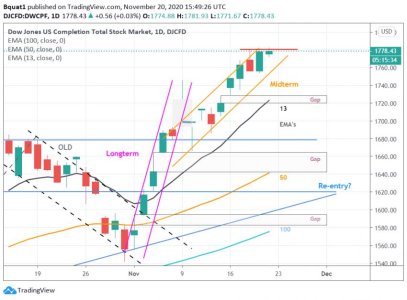
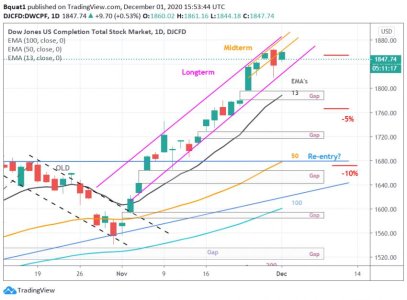
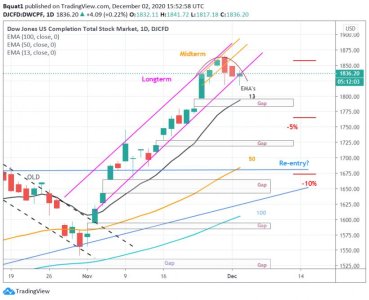
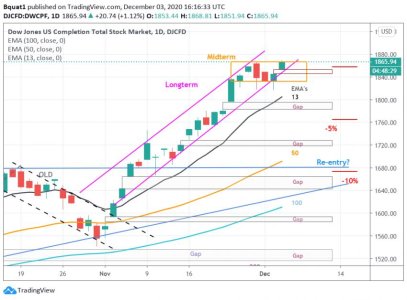
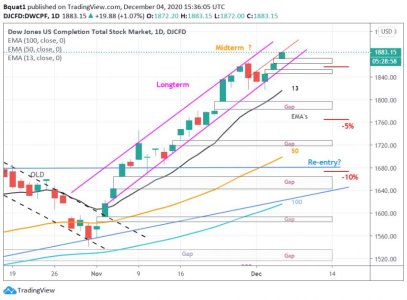
I have missed the last two up channels.:embarrest: The good news keeps coming. Should I change my outlook from being worried about all the news gaps and become slightly news bullish::blink:I think we are trying to top out right now but good news keeps coming when needed. Myself I'm not entering worried about the gaps below. The continuing news about vaccines coming out can make me wrong. I think the recent vaccine news my already be factored in but who knows for sure.:notrust:
This is what kills me, what are the odds of the next dip, the bottom of which won't be above this point?
I think weakness may continue today. Not thinking of entering yet but wondering if I want to enter before vaccines become available.:blink:Finally some weakness. First gap filled. Bought back prior to bottom of long term channel. Not enough dip for me to buy:
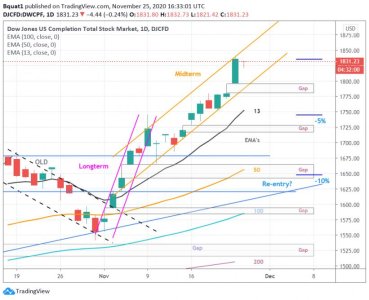
 Good news just seems to come out at the time it's needed::suspicious: