-
The Forum works well on MOBILE devices without an app: Just go to: https://forum.tsptalk.com
-
Please read our AutoTracker policy on the IFT deadline and remaining active. Thanks!
-
$ - Premium Service Content (Info) | AutoTracker Monthly Winners | Is Gmail et al, Blocking Our emails?
Find us on: Facebook & X | Posting Copyrighted Material
-
Join the TSP Talk AutoTracker: How to Get Started | Login | Main AutoTracker Page
You are using an out of date browser. It may not display this or other websites correctly.
You should upgrade or use an alternative browser.
You should upgrade or use an alternative browser.
Bquat's Account Talk
- Thread starter Bquat
- Start date

nnuut
Moderator | TSP Talk Royalty
- Reaction score
- 210
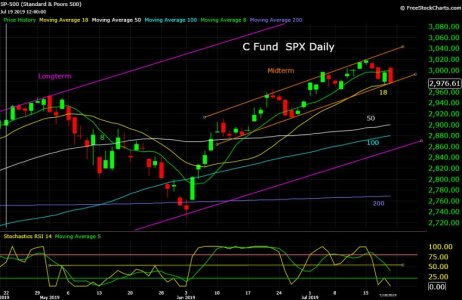
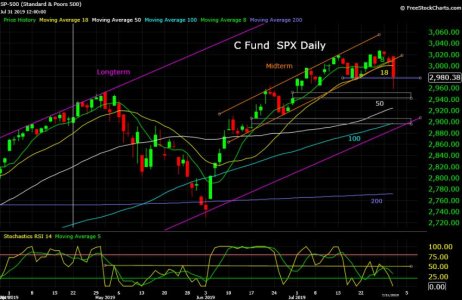
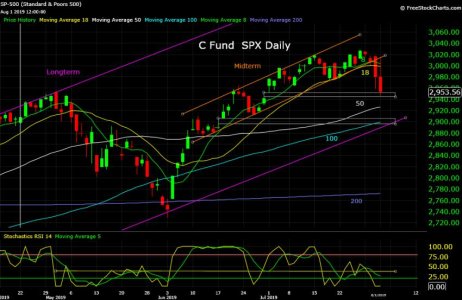
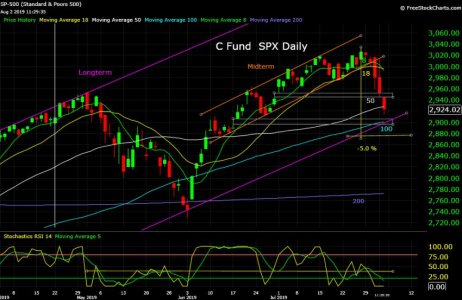
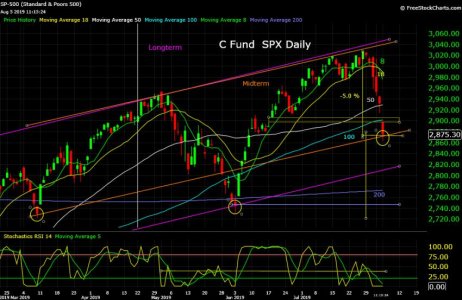
What do you think about those 2 GAPS 2900 and 2940?"F" flag bullish until it isn't. S&P 500 Chart:
Bquat
TSP Talk Royalty
- Reaction score
- 815
70/30 top gap gets filled and 50/50 on the second one. Looks like timing wise it will hit my 50 day right when were overbought and the market is really looking for a 50 day test. 40/60 for 100 Day test. Just my guess::cheesy:What do you think about those 2 GAPS 2900 and 2940?
Attachments
Bquat
TSP Talk Royalty
- Reaction score
- 815
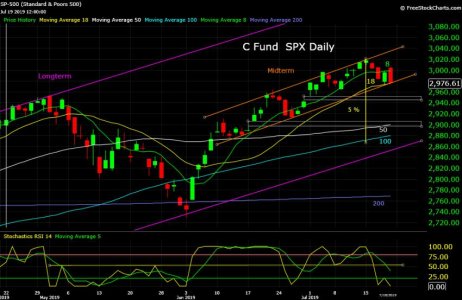
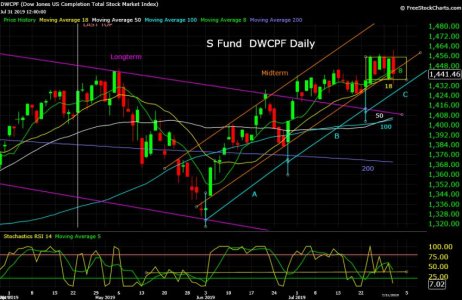
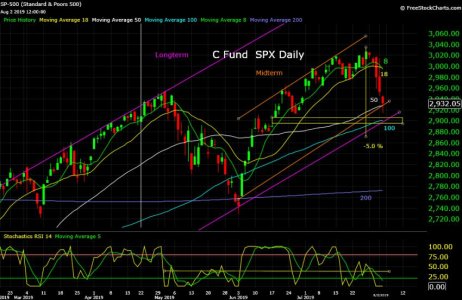
Yes sideways consolidation is good but flat tops can have a big drop. Consolidating sideways past the channel makes this more like a flat top. The coin is in the air since we are in an over sold condition but we can embed to the down side in a couple of days. Watching the box for direction:
Attachments
Mcqlives
Market Veteran
- Reaction score
- 24
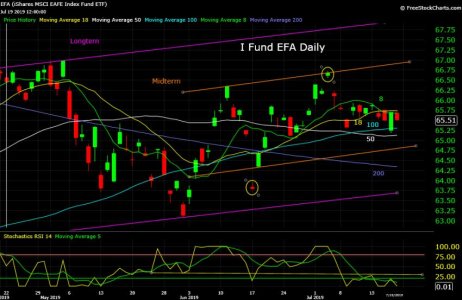
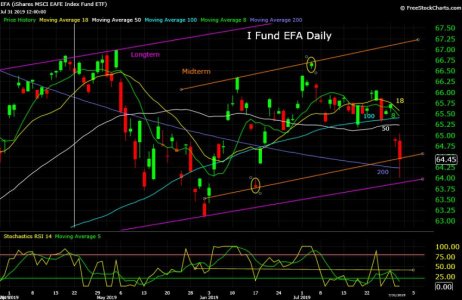
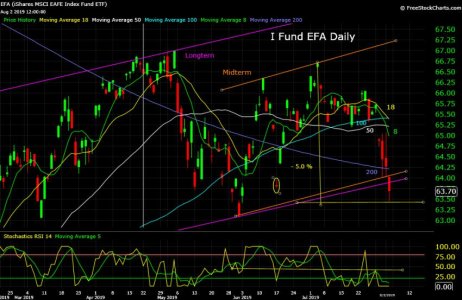
Thanks! I wish I had messed with the I fund chart before I moved yesterday. That gives me a higher concern for our overall economic health. I may have waited longer. I’ll see where this ride takes me but am hoping the positioning move gives me a chance to get back out with a profit before the c fund gap gets filled.

Bquat
TSP Talk Royalty
- Reaction score
- 815
Similar threads
- Replies
- 2
- Views
- 697