-
The Forum works well on MOBILE devices without an app: Just go to: https://forum.tsptalk.com
-
Please read our AutoTracker policy on the IFT deadline and remaining active. Thanks!
-
$ - Premium Service Content (Info) | AutoTracker Monthly Winners | Is Gmail et al, Blocking Our emails?
Find us on: Facebook & X | Posting Copyrighted Material
-
Join the TSP Talk AutoTracker: How to Get Started | Login | Main AutoTracker Page
You are using an out of date browser. It may not display this or other websites correctly.
You should upgrade or use an alternative browser.
You should upgrade or use an alternative browser.
Bquat's Account Talk
- Thread starter Bquat
- Start date
Go we here, yes?
Great. Tia
Bquat
TSP Talk Royalty
- Reaction score
- 824
I know you are but what about me?Great. Tia

I know you are but what about me?
I didn't mean to sound insensitive. Good luck!
Bquat
TSP Talk Royalty
- Reaction score
- 824
I was just joking there.I didn't mean to sound insensitive. Good luck!
Whipsaw
Market Veteran
- Reaction score
- 304
I still have a conspiracy theory on our deadline. Too close for me to call so no move today. Playing with a descending channel::suspicious:
Amazing, makes the call on the post noon deadline change in market character!

Mcqlives
Market Veteran
- Reaction score
- 24
Because of today's action, I am wondering about my river line placement. I'm thinking the upper one because of increased volatility and being below the 50 Day. Also we could bounce after filling the gap at the waiting line:
I like the upper river line as well...plus it conforms more to the 20/50 line cross we may see soon.
Bquat
TSP Talk Royalty
- Reaction score
- 824
I think I'll redraw when I get back.I like the upper river line as well...plus it conforms more to the 20/50 line cross we may see soon.

Bquat
TSP Talk Royalty
- Reaction score
- 824
Do give me acrophobia.I'd like to see that spider spin your lines!View attachment 29907
Hmm I would love to see the visual representation of that.")
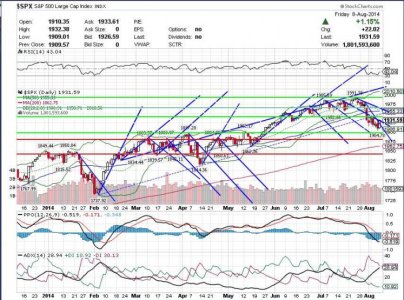
see if this one loads.
Okay, so this is a rough that I did last week. Wasn't planning on posting this anywhere but it gives the jist of what I was talking about. My X's aren't very clean and it doesn't look all that great. I'll do a better one when I get a chance.
Attachments
Last edited:
see if this one loads.
Okay, so this is a rough that I did last week. Wasn't planning on posting this anywhere but it gives the jist of what I was talking about. My X's aren't very clean and it doesn't look all that great. I'll do a better one when I get a chance.
Originally Posted by BooDog

Very interesting seeing what works for other technical traders. I use a modified P&F (point and figure) usually starting from a 6 - 8 month daily and zoom in from there with other indicators. Drawing X's on each uptrend and down trend cycle. Where the X's intersect horizontally drawing the lines to the right margin. Most often they are on the critical support and resistance levels so one could simply eyeball the chart. Eventually I use the stochastic family, MFI, momo and sometime a few others along with divergence (PPO and ADX with +/-DI) to watch for pincher set ups.
meant to edit this into the last post. Sometimes I am a bit more organized. Really.
Bquat
TSP Talk Royalty
- Reaction score
- 824
Thanks for sharing your info.meant to edit this into the last post. Sometimes I am a bit more organized. Really.
Similar threads
- Replies
- 2
- Views
- 704