Bquat's Account Talk

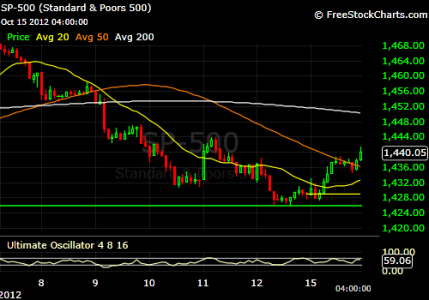
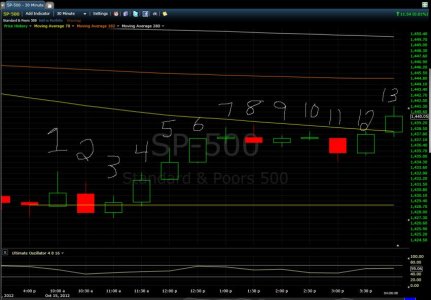
In this time period there is 14 squares between the start and finish of a trading day. IE: 5 x 14 = 70 etc.

Hmm...I see the 14 squares in the chart on the left, but not on the right. I guess they are there, but the chart is cutoff or whatever. Why does that setting change just from changing the time period? I would think a moving average would be the same period and just look different the farther you zoom in/out. I'm a newbie still so forgive all of my questions. I would have just thought freestockcharts.com was programmed to be smart enough to adjust whatever is necessary and be able to just put that you want a 7 day moving average or whatever.

Thanks again for your help!
When I'm in the hourly there's 1 candle each hour and each period is one hour. Ie: 280 hours divided by 7 = 40 days. It's a multiplier of the periods within the day not a multiplier of days. So the scale changes each change of time frame as the multiplyer is the same. They are calculated moving average for that time frame. I would have to change my multipliers for a different time frame if I use it more reguraly.
 
Like here is a 30 minute chart that I made on the SP-500 like yours, but I used Moving Average 20, 50, and 200. It looks exactly like yours I do believe. I just don't get how you have to use much larger numbers to get the same result. I might just be crazy too. ;)

Edit - Actually I guess it doesn't look exactly the same. All three of your moving averages were above current price where as mine aren't. Hmm...
 

Attachments

  • test.png
    test.png
    33.4 KB · Views: 42
Like here is a 30 minute chart that I made on the SP-500 like yours, but I used Moving Average 20, 50, and 200. It looks exactly like yours I do believe. I just don't get how you have to use much larger numbers to get the same result. I might just be crazy too. ;)
Divide your numbers by 14 and you see the days they represent.
 
Like here is a 30 minute chart that I made on the SP-500 like yours, but I used Moving Average 20, 50, and 200. It looks exactly like yours I do believe. I just don't get how you have to use much larger numbers to get the same result. I might just be crazy too. ;)

Edit - Actually I guess it doesn't look exactly the same. All three of your moving averages were above current price where as mine aren't. Hmm...
You see how your 20 period changed direction in 1 1/2 days and not 20 days. I think if you go to a daily chart they'll represent correctly. You have the 20, 50 and 200 period averages and the period is 1/2 hour.
 
You see how your 20 period changed direction in 1 1/2 days and not 20 days. I think if you go to a daily chart they'll represent correctly. You have the 20, 50 and 200 period averages and the period is 1/2 hour.

Gotcha. I also found this FAQ on the freestockcharts website
[h=3]Why does the value of my 50-day moving average change when I go from a Daily chart to a Weekly chart?[/h]All indicators are plotted using periods. The period changes with the bar interval on the chart. A 50 period moving average on a Daily chart is a 50-day moving average. A 50 period moving average on a weekly chart is a 50-week moving average.

I'm understanding it now, but can you take a look at my last post above? Thanks a lot!
 
I think I'm understanding now, but wouldn't you use 13 since there is 13 30 minute blocks in a trading day?
1 trading day
7 hours
14 1/2 hours 14 candles
13 trading days is 182 1/2 hours 182 candles 182 moving average is the average of the 182 half hour periods 13 days.
 
1 trading day
7 hours
14 1/2 hours 14 candles
13 trading days is 182 1/2 hours 182 candles 182 moving average is the average of the 182 half hour periods 13 days.

The stock market opens at 9:30 PM EST and closes at 4:00 PM EST though...sorry about my confusion and I appreciate you helping me understand this. I'm not sure where the extra 30 minutes is coming from though lol.
 
Gotcha. I also found this FAQ on the freestockcharts website
Why does the value of my 50-day moving average change when I go from a Daily chart to a Weekly chart?

All indicators are plotted using periods. The period changes with the bar interval on the chart. A 50 period moving average on a Daily chart is a 50-day moving average. A 50 period moving average on a weekly chart is a 50-week moving average.

I'm understanding it now, but can you take a look at my last post above? Thanks a lot!
You got it.
 
Here I'm breaking it down easy for myself lol. Why would we count the candlestick from 4:00 PM the prior day for the 14 count?
 

Attachments

  • Capture.jpg
    Capture.jpg
    73.8 KB · Views: 61
I guess I need to go scratch my head and think about this a little more. I guess the candlestick on 4:00 PM is counting for the next day as well or something? I would think it would be getting counted for two different days then. I think I need to just go to sleep now. Too much thinking too late at night for me. :D
 
Here I'm breaking it down easy for myself lol. Why would we count the candlestick from 4:00 PM the prior day for the 14 count?
I think you may be right with 13. I guess the market opens at 9 am but the first candle finishes at 10 am. I'll have to figure that also. Maybe watch the open and see the first candle.
 
Today we should see a confirmation of the move and recapture the 13 day. We may even test the 1450 area and the my 20 day. If we break my 20 day, bears will have to start covering. :)
 
Here I'm breaking it down easy for myself lol. Why would we count the candlestick from 4:00 PM the prior day for the 14 count?
You are right. Market opens at 9:30 and goes to 4:00 pm. Your the first to notice. I'll have to recompute.
 
Today we should see a confirmation of the move and recapture the 13 day. We may even test the 1450 area and the my 20 day. If we break my 20 day, bears will have to start covering. :)
Bada bing got it by golly.:)
 
Super computers are waiting on user input. Have reached 1450ish too early and the programs need the green button pushed for next buy. So we need to hold here a few minutes.
 
Thanks MaSta, my 20 day seems right at the right spot.:) and holding. 6 more minutes and we see more action.
 
Back
Top