blueroadster
TSP Strategist
- Reaction score
- 9
Hi All,
This is my first post so I figured I'd start my own account thread. Since registering, I spent time reading and learning as I was previously unfamiliar with a lot of the investment/financial management lingo. Over the last several months, I learned quite a bit from this site and others about the importance of understanding this lingo as well as the need to actively manage my TSP account.
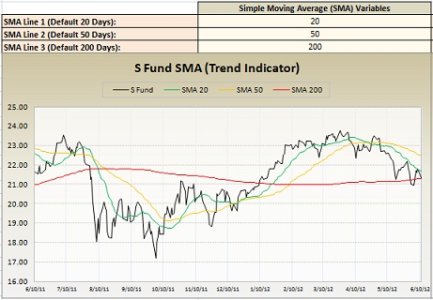
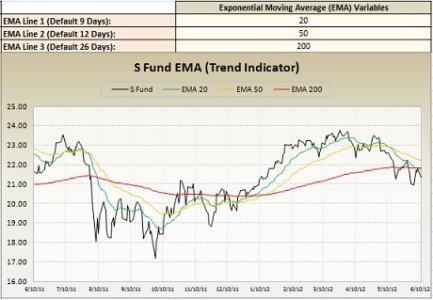
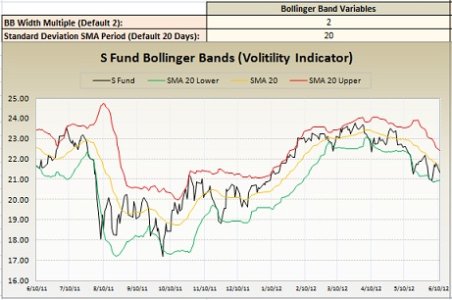
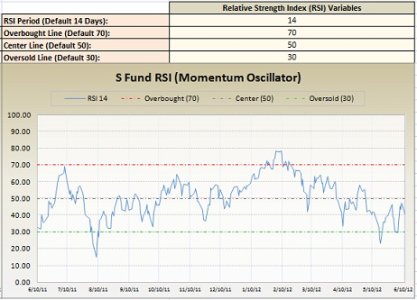
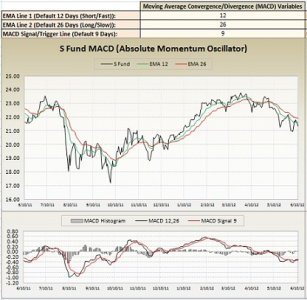
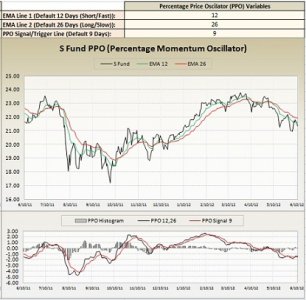
On that note, I look forward to learning more and wanted to share what I have been working on in return. The attached file is what I call TSP Tracker. The TSP Tracker is an Excel based file that dynamically charts several of the TSP funds for technical analysis purposes. The file does not contain any macros and all formulas used for the calculations can be viewed.
From a user perspective, the file is updated simply by inserting a new row above row 5 on the "Prices" (red worksheet tab) to add the latest closing prices for each TSP fund. All other worksheets in the workbook are then updated on the fly. The "TSP_Returns" (yellow worksheet tab) calculates annual return values and only needs to be updated at the beginning of each calendar year. All other worksheets have a green tab color and do not require any changes or updates.
Any comments or suggestions on the TSP Tracker file would be welcome. I also look forward to being an active and contributing member to the community.
Cheers,
Eric


