Week-15 was a wild ride.
In terms of TSP with the 2-IFT limit, and a 12-Noon decision Vs. EoD Price Execution, volatility is not our friend.
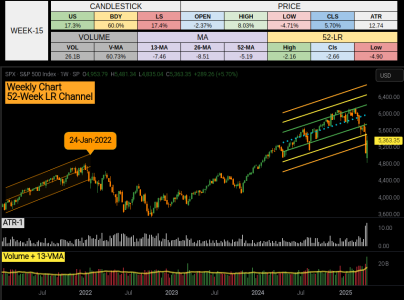
___The -2.37% weekly open was the 6th worst
___The ATR was 12.74% the 16th largest
___Volume above it's 13-MA was very high, ranking in the Top .8% range
___Week-15's Low was Std. Dev. -4.90 ranking in the Bottom .4% range
While I can't predict the next 1-13 weeks, we can isolate our current conditions, and analyze the historical performance.
Here are the 7 filtered conditions from 3.3K weeks we can review.
___ATR > Average ATR of 3.20%
___Volume > Volume's 13-Week Volume-Moving Average
___Price closed below the 13/26/52 Week Moving Averages
___Standard Deviation < 0 (currently -2.66) from 52-Week Linear Regression Channel
______Despite recent weakness the center-line slope tilts upward (slope 13)
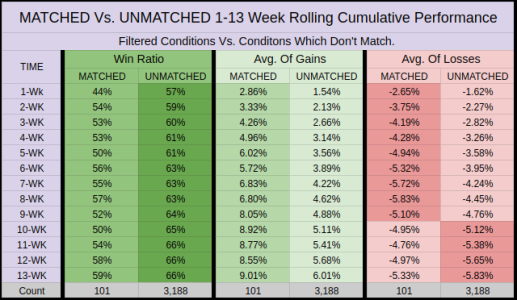
This gives us 101-Matched weeks to compare against 3188-Unmatched Weeks.
___Matched Conditions have consistently lower win ratios.
___Although we win less often, Matched Conditions have consistently Higher Average-Of-Gains
___Matched Conditions have worse Average-Of-Losses across the first 9 Weeks
The game has changed.
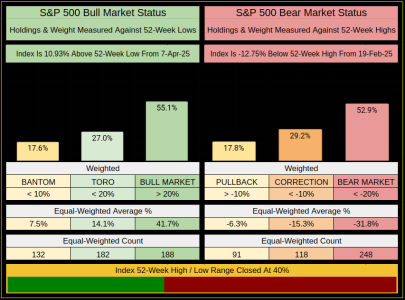
The previous 19-Apr-2024 52-Week low has been erased by 7-Apr-2025.
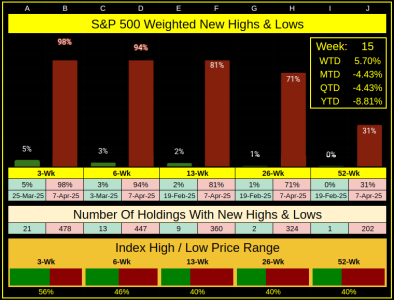
As we can see by the weight of the internal holdings, things look fairly evenly matched.
But given the 52-Wk Low is now in front of the 52-Wk High, and we are at 40% of our high/low range, I'd give the nod to the bears.
So many new 13-Week Lows, yet we end the week positive with a strong 5.70% gain.
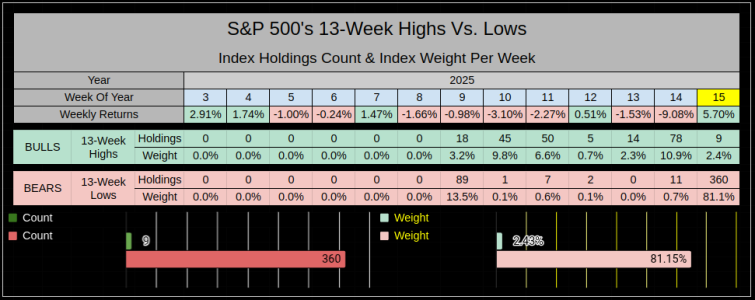
Funny to think the week ended 5.70% but we are down MTD -4.43%
These are the strongest bearish readings we've seen since I started posting these charts.
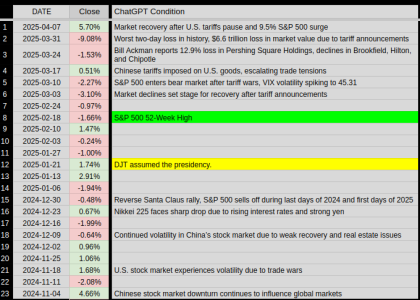
Should be an interesting week, the News-Table below is still a draft, but from time to time I'll review what's happened over past weeks.
Have a great week, and thanks for reading...Jason
In terms of TSP with the 2-IFT limit, and a 12-Noon decision Vs. EoD Price Execution, volatility is not our friend.
___The -2.37% weekly open was the 6th worst
___The ATR was 12.74% the 16th largest
___Volume above it's 13-MA was very high, ranking in the Top .8% range
___Week-15's Low was Std. Dev. -4.90 ranking in the Bottom .4% range

While I can't predict the next 1-13 weeks, we can isolate our current conditions, and analyze the historical performance.
Here are the 7 filtered conditions from 3.3K weeks we can review.
___ATR > Average ATR of 3.20%
___Volume > Volume's 13-Week Volume-Moving Average
___Price closed below the 13/26/52 Week Moving Averages
___Standard Deviation < 0 (currently -2.66) from 52-Week Linear Regression Channel
______Despite recent weakness the center-line slope tilts upward (slope 13)
This gives us 101-Matched weeks to compare against 3188-Unmatched Weeks.
___Matched Conditions have consistently lower win ratios.
___Although we win less often, Matched Conditions have consistently Higher Average-Of-Gains
___Matched Conditions have worse Average-Of-Losses across the first 9 Weeks

The game has changed.
The previous 19-Apr-2024 52-Week low has been erased by 7-Apr-2025.
As we can see by the weight of the internal holdings, things look fairly evenly matched.
But given the 52-Wk Low is now in front of the 52-Wk High, and we are at 40% of our high/low range, I'd give the nod to the bears.

So many new 13-Week Lows, yet we end the week positive with a strong 5.70% gain.

Funny to think the week ended 5.70% but we are down MTD -4.43%
These are the strongest bearish readings we've seen since I started posting these charts.

Should be an interesting week, the News-Table below is still a draft, but from time to time I'll review what's happened over past weeks.
Have a great week, and thanks for reading...Jason

