While some sentiment surveys are on the bullish side, ours is not one of them. Our sentiment survey came in at 29% bulls to 66% bears. It isn't often we see that many bears in our poll. We know it's bullish as sentiment goes, but how bullish? I've got some data to give you an idea. Here's this week's charts:
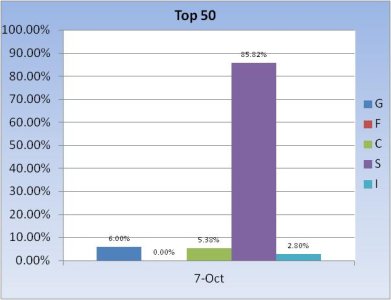
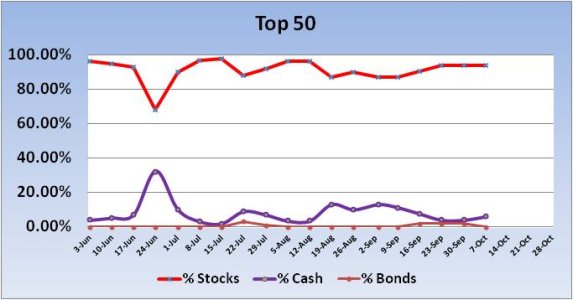
No signal was generated from the Top 50 this week. Stock allocations were the same as last week (94%). That is bullish in my view.
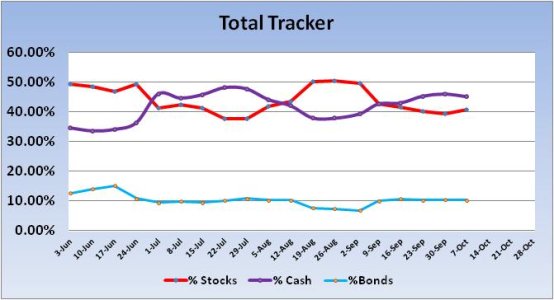
No signal was generated from the Total Tracker this week. Stock allocations inched up modestly and total stock allocations are now back over 40%, but not by much.
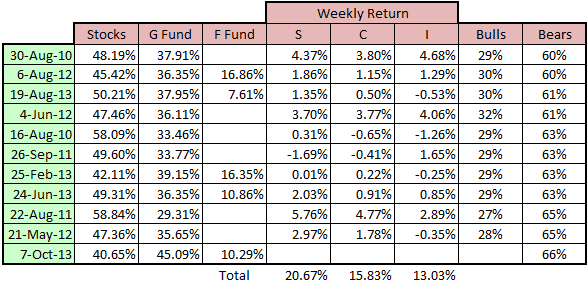
Here's some data on overly bearish sentiment readings for our survey. Going back to July of 2010, I found eleven weeks (11) where bearish sentiment was 60% or more. In those eleven weeks, had you been invested 100% in the S fund, you would have realized a gain of 20.67%. And there were significant gains in the C and I funds too. I could have thrown in some high 50's bearish readings too, as they saw some significant gains as well. One other thing I note about this chart is that our total stock allocation for this week is the lowest of all eleven weeks with bearish levels over 60%.
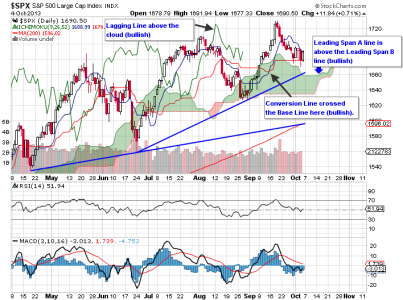
The S&P 500 continues to see more weakness than the Wilshire 4500, but the chart remains bullish (longer term) using the Ichimoku clouds as a guide. Trend support is not far below price (rising trend support line and Leading Span A line). RSI and MACD are largely flat and neutral. Last week, I did expect more selling pressure and said I was looking for the 1660 area as a first line of support. We got the selling pressure and price has so far remained above support.
To see this week's full analysis, follow this link http://www.tsptalk.com/members/


No signal was generated from the Top 50 this week. Stock allocations were the same as last week (94%). That is bullish in my view.

No signal was generated from the Total Tracker this week. Stock allocations inched up modestly and total stock allocations are now back over 40%, but not by much.

Here's some data on overly bearish sentiment readings for our survey. Going back to July of 2010, I found eleven weeks (11) where bearish sentiment was 60% or more. In those eleven weeks, had you been invested 100% in the S fund, you would have realized a gain of 20.67%. And there were significant gains in the C and I funds too. I could have thrown in some high 50's bearish readings too, as they saw some significant gains as well. One other thing I note about this chart is that our total stock allocation for this week is the lowest of all eleven weeks with bearish levels over 60%.

The S&P 500 continues to see more weakness than the Wilshire 4500, but the chart remains bullish (longer term) using the Ichimoku clouds as a guide. Trend support is not far below price (rising trend support line and Leading Span A line). RSI and MACD are largely flat and neutral. Last week, I did expect more selling pressure and said I was looking for the 1660 area as a first line of support. We got the selling pressure and price has so far remained above support.
To see this week's full analysis, follow this link http://www.tsptalk.com/members/
