JTH
TSP Legend
- Reaction score
- 1,158
Bear Market Warning.
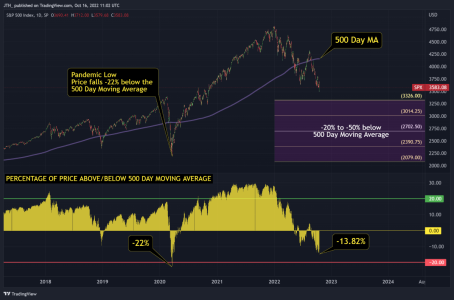
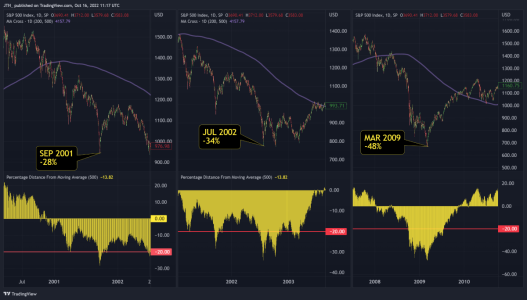
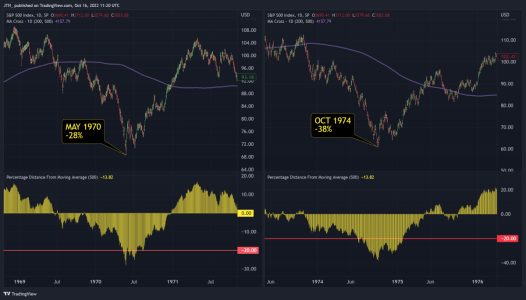
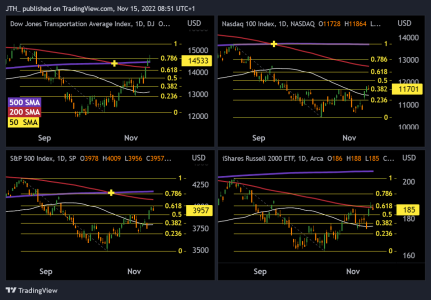
Previous studies I've done had identified the 493SMA as the single most profitable Simple Moving Average throughout the entire history of the S&P 500.
The 493rd is at 1020.66, but for simplicity I round it out to the 500SMA, and right now we are testing those levels.
View attachment 9647
Previous studies I've done had identified the 493SMA as the single most profitable Simple Moving Average throughout the entire history of the S&P 500.
The 493rd is at 1020.66, but for simplicity I round it out to the 500SMA, and right now we are testing those levels.
View attachment 9647


