JTH
TSP Legend
- Reaction score
- 1,158
Happy Sunday
Please feel free to comment, all perspectives are welcome
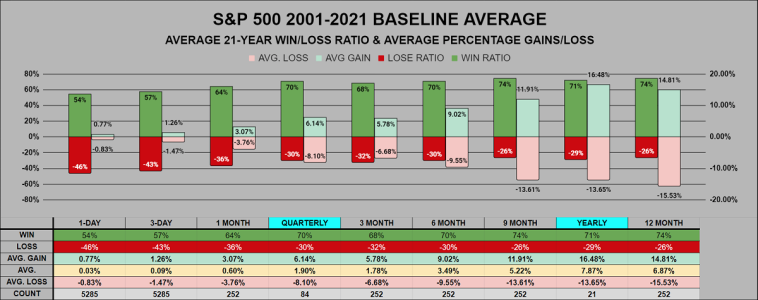
Looking at the 21-year average, we can see the longer you stay in, the greater your chance for success. The 1-day average win ratio is 54% while it climbs to 74% on a rolling 12-month chart.
____________________
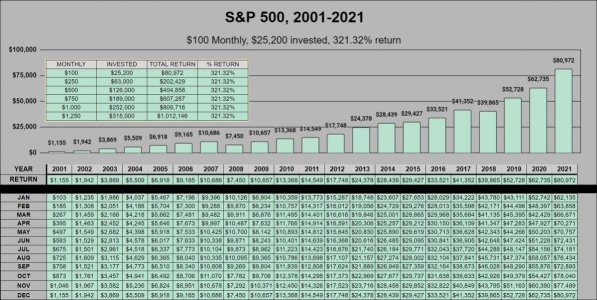
Looking at the chart below, I must admit I was a bit surprised and at the same time disappointed. Back in 2001, I remember old timers telling me to just invest $100 a month and "Don't look at it." Over these past 21 years, if you wanted to be a millionaire, you would have needed to invest $1,250 monthly. This data doesn't consider the expense ratio of many of the mutual funds that were offered at the time.
Time is your friend:
$100 a month over 21 years, $25,200 invested earns $80,972, for a 321.23% return.
$100 a month over 42 years, $50,400 invested earns $521,128 for a 1033.98% return.
________________________
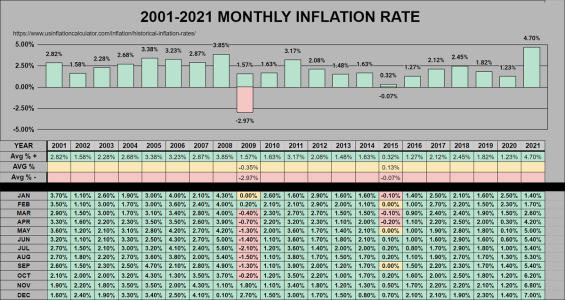
Finally we have our beloved inflation chart, the total average is 2.19% I'm not sure if I believe that. Inflation is the real thief, if we lost an average 2.19% inflation over the past 21 years, did we lose 46% of our value or do we have less earning power?
LINK: "According to the U.S. Bureau of Labor Statistics, prices for carbonated drinks were 48.23% higher in 2021 versus 2001 (a $9.65 difference in value)."
Please feel free to comment, all perspectives are welcome
Looking at the 21-year average, we can see the longer you stay in, the greater your chance for success. The 1-day average win ratio is 54% while it climbs to 74% on a rolling 12-month chart.

____________________
Looking at the chart below, I must admit I was a bit surprised and at the same time disappointed. Back in 2001, I remember old timers telling me to just invest $100 a month and "Don't look at it." Over these past 21 years, if you wanted to be a millionaire, you would have needed to invest $1,250 monthly. This data doesn't consider the expense ratio of many of the mutual funds that were offered at the time.
Time is your friend:
$100 a month over 21 years, $25,200 invested earns $80,972, for a 321.23% return.
$100 a month over 42 years, $50,400 invested earns $521,128 for a 1033.98% return.

________________________
Finally we have our beloved inflation chart, the total average is 2.19% I'm not sure if I believe that. Inflation is the real thief, if we lost an average 2.19% inflation over the past 21 years, did we lose 46% of our value or do we have less earning power?
LINK: "According to the U.S. Bureau of Labor Statistics, prices for carbonated drinks were 48.23% higher in 2021 versus 2001 (a $9.65 difference in value)."


