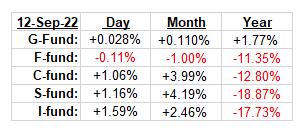
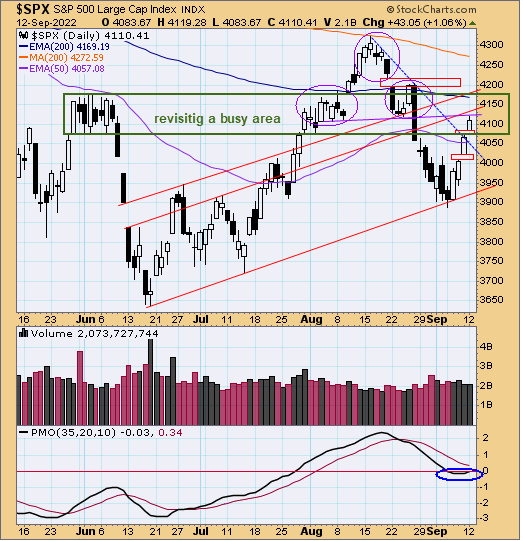
A Monday morning gap up in stocks set the tone for the day. We can't always trust gaps on Mondays because often it is emotional retail money chasing the prior week's action. Well, we saw some of that but it held all day long so there is another open gap below on the S&P 500 chart. The Dow gained 230-points, which was about 125-points off the highs, but we did see a strong close after some midday choppiness. The dollar was down sharply so prices everywhere were being boosted higher - metals, oil, bitcoin, etc.
[TABLE="align: center"]
[TR]
[TD="align: center"]
 [/TD]
[/TD]
[TD]
[/TD]
[TD="width: 338, align: center"] Daily TSP Funds Return
 [TABLE="align: center"]
[TR]
[TD="align: right"][/TD]
[/TR]
[/TABLE]
[/TD]
[/TR]
[/TABLE]
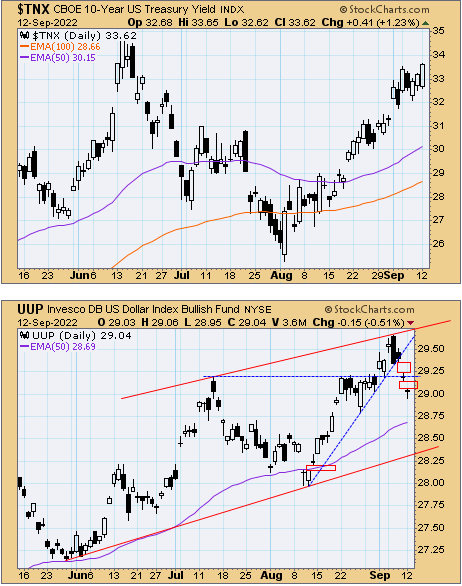
Bond yields were up with the 10-year Treasury closing at its highest level since mid-June. The price of oil was up well, so isn't the market supposed to go down when that happens? That has been the trend recently but as I said, the emotional aspects of Mondays and the anticipation of today's CPI number being much lower than last month, brought in what could have been some FOMO buying - fear of missing out.
I don't know what the CPI will be but it is going to be the catalyst today. Perhaps there was a whisper number being circulated because we did see a lot of buying in the last half hour of trading, and even into to after hours with the futures.
I'm sure the Administration would love to see a CPI number with a 7-handle (~ 7.9%), but estimates are looking for year over year growth of 8.1% for August, which would be lower than July's 8.5%.

Here's the yield on the 10-year sitting at 3.36%. The 2-year is at 3.57% so that is still an inverted yield curve, and I probably don't have to remind you that inversions tend to lead to a recession.

The dollar was taken down again so that pullback has been rather stark in recent days, coming off the highs. It remains in an uptrend but it is in the middle of the wide longer-term rising trading channel. There are open gaps above that could draw it back up in the short-term. The dollar has had quite a run in the previous quarter so when earnings start to come out in October, it will almost certainly negatively impact the bottom line of the larger global stocks, or any company that does a lot of business overseas.
This is a key options expiration week and it does have an historically positive bias (with next week being very negative) but the CPI Report comes out before the opening bell this morning and that probably changes any typical movement. It could be better or worse than estimates. It has been decades since we've had CPI report that had much meaning, and now it's all everyone is waiting for.
Whatever it turns out to be, the bigger picture may be a little more muddled. Some say signs of a declining CPI opens the door to the next bull market, and since the market does tend to look many months ahead into the future, maybe that will be the case. But we know that interest rate increases don't really show up, or get felt in the economy until maybe 9 months after they are raised. We're probably only just starting to feel that first rate hike that we got early in the year, and not only has the Fed continued to hike since that first one, they plan to do more.
2023 earnings estimates have not taken this into consideration, and they will be coming down. Rising rates, lower earnings, and economic headwinds for the rest of 2022 and into 2023 does not sound like a reason yet, to start a new bull market. Oh, and that inverted yield curve suggests a recession in there somewhere as well.
Maybe I'm wrong and all of this mess has been priced in already. But if that's the case I think the S&P 500 would have lost more than the 20% that it was down at the June lows. In the dot com bubble burst the Nasdaq lost 78% and in the financial crisis the losses were near 40%.
Perhaps this inflation issue isn't in the same league, but stock prices had been so overvalued on an historical basis for years so just coming down to typical P/E's and a 20% decline doesn't sound like the bottom. Not to mention that in bear markets valuations tend to move into undervalued territory before the we see a bottom.
15.8% is the average historical Price to Earnings ratio of the S&P 500. With earnings estimates at $220 for 2023, that would be a P/E ratio of 18.7% using today's prices, so once they start lowering earnings estimates, that's only going to go higher, even if the S&P 500 doesn't go higher.
So using the $220, which we know will be coming down, if the P/E ratio comes down to the 15.8% average, the S&P 500 (currently 4110) would have to be 3464. If the estimates for earnings goes down to $198 (down 10%), which seems reasonable but just a guess, a 15.8% P/E ratio would put the S&P 500 near 3118. And again, more typical in a bear market is that the P/E ratio goes below the average (15.8%) before it stabilizes and heads back up.
That said, the intraday charts look good after the recent rally and the after hours trading shows more gains so it looks like the S&P is primed for more gains at least heading to the CPI release this morning. Once that CPI report comes out ... be careful! We do have a set up for a potential sell the news reaction no matter what it is.
The S&P 500 (C-fund) gapped up and jumped above the descending resistance line at the opening bell yesterday. It is now back in that area that we have seen the chart gravitate towards several times in the last few months (green rectangle.) It is also hit and paused at the neckline of that small head and shoulders pattern (purple.) There are now a couple of open gaps between yesterday's low and 4011. Yeah, it's a busy chart so sorry that it's tough to see everything going on.

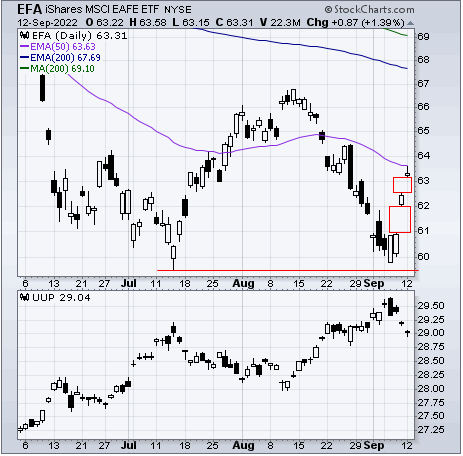
The DWCPF (S-fund / small caps) was also up just over 1%, but it was the EFA (I-fund) that led because of the 0.51% decline in the dollar yesterday. However, the chart left two large gaps open in its wake and ran into the 50-day EMA where it found resistance.

Read more in today's TSP Talk Plus Report. We post more charts, indicators and analysis, plus discuss the allocations of the TSP and ETF Systems. For more information on how to gain access and a list of the benefits of being a subscriber, please go to: www.tsptalk.com/plus.php
For more info our other premium services, please go here... www.tsptalk.com/premiums.html
To get weekly or daily notifications when we post new commentary, sign up HERE.
Thanks so much for reading. We'll see you back here tomorrow.
Tom Crowley
Posted daily at www.tsptalk.com/comments.php
The legal stuff: This information is for educational purposes only! This is not advice or a recommendation. We do not give investment advice. Do not act on this data. Do not buy, sell or trade the funds mentioned herein based on this information. We may trade these funds differently than discussed above. We use additional methods and strategies to determine fund positions.
[TABLE="align: center"]
[TR]
[TD="align: center"]

[TD]
[/TD]
[TD="width: 338, align: center"] Daily TSP Funds Return

[TR]
[TD="align: right"][/TD]
[/TR]
[/TABLE]
[/TD]
[/TR]
[/TABLE]
Bond yields were up with the 10-year Treasury closing at its highest level since mid-June. The price of oil was up well, so isn't the market supposed to go down when that happens? That has been the trend recently but as I said, the emotional aspects of Mondays and the anticipation of today's CPI number being much lower than last month, brought in what could have been some FOMO buying - fear of missing out.
I don't know what the CPI will be but it is going to be the catalyst today. Perhaps there was a whisper number being circulated because we did see a lot of buying in the last half hour of trading, and even into to after hours with the futures.
I'm sure the Administration would love to see a CPI number with a 7-handle (~ 7.9%), but estimates are looking for year over year growth of 8.1% for August, which would be lower than July's 8.5%.

Here's the yield on the 10-year sitting at 3.36%. The 2-year is at 3.57% so that is still an inverted yield curve, and I probably don't have to remind you that inversions tend to lead to a recession.

The dollar was taken down again so that pullback has been rather stark in recent days, coming off the highs. It remains in an uptrend but it is in the middle of the wide longer-term rising trading channel. There are open gaps above that could draw it back up in the short-term. The dollar has had quite a run in the previous quarter so when earnings start to come out in October, it will almost certainly negatively impact the bottom line of the larger global stocks, or any company that does a lot of business overseas.
This is a key options expiration week and it does have an historically positive bias (with next week being very negative) but the CPI Report comes out before the opening bell this morning and that probably changes any typical movement. It could be better or worse than estimates. It has been decades since we've had CPI report that had much meaning, and now it's all everyone is waiting for.
Whatever it turns out to be, the bigger picture may be a little more muddled. Some say signs of a declining CPI opens the door to the next bull market, and since the market does tend to look many months ahead into the future, maybe that will be the case. But we know that interest rate increases don't really show up, or get felt in the economy until maybe 9 months after they are raised. We're probably only just starting to feel that first rate hike that we got early in the year, and not only has the Fed continued to hike since that first one, they plan to do more.
2023 earnings estimates have not taken this into consideration, and they will be coming down. Rising rates, lower earnings, and economic headwinds for the rest of 2022 and into 2023 does not sound like a reason yet, to start a new bull market. Oh, and that inverted yield curve suggests a recession in there somewhere as well.
Maybe I'm wrong and all of this mess has been priced in already. But if that's the case I think the S&P 500 would have lost more than the 20% that it was down at the June lows. In the dot com bubble burst the Nasdaq lost 78% and in the financial crisis the losses were near 40%.
Perhaps this inflation issue isn't in the same league, but stock prices had been so overvalued on an historical basis for years so just coming down to typical P/E's and a 20% decline doesn't sound like the bottom. Not to mention that in bear markets valuations tend to move into undervalued territory before the we see a bottom.
15.8% is the average historical Price to Earnings ratio of the S&P 500. With earnings estimates at $220 for 2023, that would be a P/E ratio of 18.7% using today's prices, so once they start lowering earnings estimates, that's only going to go higher, even if the S&P 500 doesn't go higher.
So using the $220, which we know will be coming down, if the P/E ratio comes down to the 15.8% average, the S&P 500 (currently 4110) would have to be 3464. If the estimates for earnings goes down to $198 (down 10%), which seems reasonable but just a guess, a 15.8% P/E ratio would put the S&P 500 near 3118. And again, more typical in a bear market is that the P/E ratio goes below the average (15.8%) before it stabilizes and heads back up.
That said, the intraday charts look good after the recent rally and the after hours trading shows more gains so it looks like the S&P is primed for more gains at least heading to the CPI release this morning. Once that CPI report comes out ... be careful! We do have a set up for a potential sell the news reaction no matter what it is.
The S&P 500 (C-fund) gapped up and jumped above the descending resistance line at the opening bell yesterday. It is now back in that area that we have seen the chart gravitate towards several times in the last few months (green rectangle.) It is also hit and paused at the neckline of that small head and shoulders pattern (purple.) There are now a couple of open gaps between yesterday's low and 4011. Yeah, it's a busy chart so sorry that it's tough to see everything going on.

The DWCPF (S-fund / small caps) was also up just over 1%, but it was the EFA (I-fund) that led because of the 0.51% decline in the dollar yesterday. However, the chart left two large gaps open in its wake and ran into the 50-day EMA where it found resistance.

Read more in today's TSP Talk Plus Report. We post more charts, indicators and analysis, plus discuss the allocations of the TSP and ETF Systems. For more information on how to gain access and a list of the benefits of being a subscriber, please go to: www.tsptalk.com/plus.php
For more info our other premium services, please go here... www.tsptalk.com/premiums.html
To get weekly or daily notifications when we post new commentary, sign up HERE.
Thanks so much for reading. We'll see you back here tomorrow.
Tom Crowley
Posted daily at www.tsptalk.com/comments.php
The legal stuff: This information is for educational purposes only! This is not advice or a recommendation. We do not give investment advice. Do not act on this data. Do not buy, sell or trade the funds mentioned herein based on this information. We may trade these funds differently than discussed above. We use additional methods and strategies to determine fund positions.
