Well, we can't say we weren't getting warning signs. The Fed not only became more hawkish than expected, but Powell seemed unable to answer some simple questions, and the confusion triggered a sell first, ask questions later reaction in the stock and bond markets. The bears had their day, and any December Santa Claus rally will have to start from a much lower level. Yields and the dollar spiked higher, and ironically it was the beleaguered UnitedHealth that was the only stock in the Dow to close positive yesterday, as that index extended its losing streak to 10-days which is a 50 year record.
Do you think I acted on my concern for stocks on Tuesday? Nope. I was still heavy in stocks during yesterday's sell off. And, perhaps a Freudian oversight, yesterday's commentary was a little more upbeat as I said, but I had forgotten to upload it the night before, so you may have woken up yesterday to a repeat of Tuesday's doom and gloom report -- and then... Ugh!
This could be a disjointed commentary as different thoughts and possibilities pop into my head while I type, which could make things more confusing to anyone reading this. Let's see if I can make some sense of this.
Speaking of confusing, we knew the Fed was likely to come out with a more hawkish outlook yesterday, but they took it up a notch by suggesting that inflation is a little stickier than they wanted to see, and also suggesting the economy has been stronger than they expected. That brought out the question of why they cut rates at all yesterday, and why would they be considering more next year?
More rate cuts would help strengthen the economy even more, but it would also potentially inflame inflation, and cutting rates would in the face of that seems counter-productive, so I believe investors came away confused, and as I said, they sold because the logic didn't make sense. There is now a 91% chance of no rate cut at the January meeting.
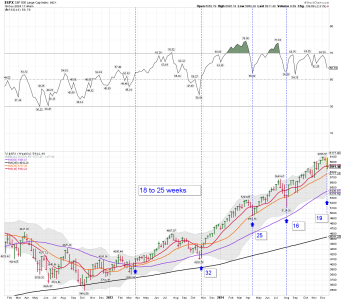
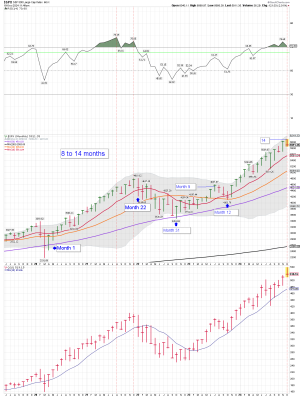
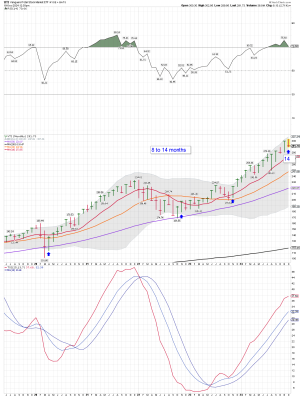
Before we look at those ugly daily charts, let's look at the weekly charts to see there is still some order to the chaos for now. If the losses weren't so sudden, these weekly charts might even look like good set ups, but the bull were just blindsided and left unsure of what to do for 2025.

Here's the ugly part: 483 stocks in the S&P 500 declined yesterday. Coincidentally it was the highest in one day since last December. The daily charts cut through support like a hot knife through butter, and suddenly my prediction that the post election large open gaps on the S&P and S-fund charts will remain open until next year, is in jeopardy.

Technically they are still open, but it's not looking good, although there is support in the area, especially on this daily S-fund chart, and the weekly one I showed above.

Now the question is whether the Santa Claus rally will be coming this year at all. A dead-cat bounce could be all we get.
Another coincidence is that yesterday I posted a chart that showed that the market in general, particularly small caps and value stocks, have been positive from the close on December 18th through the 1st trading day in January, 66 times in the last 71 years. Yesterday was the close on December 18th, so the starting point just got set a lot lower.
There is another active trend of 17 straight times that the Nasdaq had a gain in the latter half of December when the index was up 20% or more for the year, heading into the final two week.
We may get a technical victory out of those trends if stocks do bounce back in the coming days, but clearly yesterday's action was a game changer.
Yesterday I talked about sentiment not being as bullish as many were saying, and I provided some examples. That was made even more apparent yesterday because as now we see the CNN Fear & Greed Index down in the Fear Zone already.

Source: https://www.cnn.com/markets/fear-and-greed
There are now many possibilities on the table that weren't even a consideration a day ago. Before yesterday my thinking was that the bulls would push stocks higher into the end of the year, and then some time next year - January or February, the bears would come in and bring things back to reality. Now this bearish day changes that, and we have to wonder if we will we get an unusual late December correction that lasts into the end of the year and leads to a January rally, or if we do see a relief rally into the end of the year and the headwinds resumes in the new year?
It's amazing how quickly weeks worth of gains can be taken away. Most of the bulls were blindsided yesterday so now the question is whether they are stuck in stocks, or if they will they join the sell parade? The bears have taken over the momentum, but the bulls still have the historical calendar on their side. There's still a couple of weeks left in the year to see some kind of seasonal snap back rallies, but the daily charts just got a whole lot uglier.
Admin Note: Sign up for (or sign into) the AutoTracker before the end of the year to make sure you get in before the start of the new year when we starts tracking the 2025 returns.
I posted the C and S TSP fund charts up top so let me slip in these charts of the 10-year Treasury Yield and the dollar.
The 10-year is back up to the November highs, and that rally in yields in early November triggered a sharp 5-day pullback in stocks before the rally in stocks resumed. An interesting take on the Fed's action is that higher rates (because of fewer cuts) may slow down the economy and that could actually send yields lower. That could help small caps. It's an odd situation.

The dollar is making new highs for the year after breaking out yesterday, thanks to the Fed's new, less dovish, outlook on rates.
BND (bonds / F-fund) was slammed again but it too is coming to rest - at least for a day - on some strong support levels. As I said above, we could see yields move lower if the Fed is putting the breaks on rate cuts, which could soften the economy. Lower yields would help the F-fund, but that's just speculation. Let's see if the savvy bond traders see it the same way, or if they just break this chart.

ACWX (the I-fund tracking index) was down 2.47% yesterday, the I-fund was given just a 2.07% loss, but it may have been given a temporary reprieve because many of the overseas markets were closed by the time the Fed delivered his message.

You can see the updated I-fund and other TSP share prices and returns, usually posted daily by 8:30 PM ET here: https://www.tsptalk.com/tsp_share_prices.php
Thanks so much for reading! We'll see you back here tomorrow.
Tom Crowley
Read more in today's TSP Talk Plus Report. We post more charts, indicators and analysis, plus discuss the allocations of the TSP and ETF Systems. For more information on how to gain access and a list of the benefits of being a subscriber, please go to: www.tsptalk.com/plus.php
Questions, comments, or issues with today's commentary? We can discuss it in the Forum.
Daily Market Commentary Archives
For more info our other premium services, please go here... www.tsptalk.com/premiums.php
To get weekly or daily notifications when we post new commentary, sign up HERE.
Posted daily at www.tsptalk.com/comments.php
The legal stuff: This information is for educational purposes only! This is not advice or a recommendation. We do not give investment advice. Do not act on this data. Do not buy, sell or trade the funds mentioned herein based on this information. We may trade these funds differently than discussed above. We use additional methods and strategies to determine fund positions.

| Daily TSP Funds Return
More returns |
Yesterday I tried to put a more bullish spin on my paranoid bearish commentary from Tuesday that started out with, "This is going to be a gloomy report so if you don't like that sort of thing, you may want to stop reading now. And this is coming from someone who has been very bullish on stocks for the last few months."Do you think I acted on my concern for stocks on Tuesday? Nope. I was still heavy in stocks during yesterday's sell off. And, perhaps a Freudian oversight, yesterday's commentary was a little more upbeat as I said, but I had forgotten to upload it the night before, so you may have woken up yesterday to a repeat of Tuesday's doom and gloom report -- and then... Ugh!
This could be a disjointed commentary as different thoughts and possibilities pop into my head while I type, which could make things more confusing to anyone reading this. Let's see if I can make some sense of this.
Speaking of confusing, we knew the Fed was likely to come out with a more hawkish outlook yesterday, but they took it up a notch by suggesting that inflation is a little stickier than they wanted to see, and also suggesting the economy has been stronger than they expected. That brought out the question of why they cut rates at all yesterday, and why would they be considering more next year?
More rate cuts would help strengthen the economy even more, but it would also potentially inflame inflation, and cutting rates would in the face of that seems counter-productive, so I believe investors came away confused, and as I said, they sold because the logic didn't make sense. There is now a 91% chance of no rate cut at the January meeting.
Before we look at those ugly daily charts, let's look at the weekly charts to see there is still some order to the chaos for now. If the losses weren't so sudden, these weekly charts might even look like good set ups, but the bull were just blindsided and left unsure of what to do for 2025.

Here's the ugly part: 483 stocks in the S&P 500 declined yesterday. Coincidentally it was the highest in one day since last December. The daily charts cut through support like a hot knife through butter, and suddenly my prediction that the post election large open gaps on the S&P and S-fund charts will remain open until next year, is in jeopardy.

Technically they are still open, but it's not looking good, although there is support in the area, especially on this daily S-fund chart, and the weekly one I showed above.

Now the question is whether the Santa Claus rally will be coming this year at all. A dead-cat bounce could be all we get.
Another coincidence is that yesterday I posted a chart that showed that the market in general, particularly small caps and value stocks, have been positive from the close on December 18th through the 1st trading day in January, 66 times in the last 71 years. Yesterday was the close on December 18th, so the starting point just got set a lot lower.
There is another active trend of 17 straight times that the Nasdaq had a gain in the latter half of December when the index was up 20% or more for the year, heading into the final two week.
We may get a technical victory out of those trends if stocks do bounce back in the coming days, but clearly yesterday's action was a game changer.
Yesterday I talked about sentiment not being as bullish as many were saying, and I provided some examples. That was made even more apparent yesterday because as now we see the CNN Fear & Greed Index down in the Fear Zone already.

Source: https://www.cnn.com/markets/fear-and-greed
There are now many possibilities on the table that weren't even a consideration a day ago. Before yesterday my thinking was that the bulls would push stocks higher into the end of the year, and then some time next year - January or February, the bears would come in and bring things back to reality. Now this bearish day changes that, and we have to wonder if we will we get an unusual late December correction that lasts into the end of the year and leads to a January rally, or if we do see a relief rally into the end of the year and the headwinds resumes in the new year?
It's amazing how quickly weeks worth of gains can be taken away. Most of the bulls were blindsided yesterday so now the question is whether they are stuck in stocks, or if they will they join the sell parade? The bears have taken over the momentum, but the bulls still have the historical calendar on their side. There's still a couple of weeks left in the year to see some kind of seasonal snap back rallies, but the daily charts just got a whole lot uglier.
Admin Note: Sign up for (or sign into) the AutoTracker before the end of the year to make sure you get in before the start of the new year when we starts tracking the 2025 returns.
I posted the C and S TSP fund charts up top so let me slip in these charts of the 10-year Treasury Yield and the dollar.
The 10-year is back up to the November highs, and that rally in yields in early November triggered a sharp 5-day pullback in stocks before the rally in stocks resumed. An interesting take on the Fed's action is that higher rates (because of fewer cuts) may slow down the economy and that could actually send yields lower. That could help small caps. It's an odd situation.

The dollar is making new highs for the year after breaking out yesterday, thanks to the Fed's new, less dovish, outlook on rates.
BND (bonds / F-fund) was slammed again but it too is coming to rest - at least for a day - on some strong support levels. As I said above, we could see yields move lower if the Fed is putting the breaks on rate cuts, which could soften the economy. Lower yields would help the F-fund, but that's just speculation. Let's see if the savvy bond traders see it the same way, or if they just break this chart.

ACWX (the I-fund tracking index) was down 2.47% yesterday, the I-fund was given just a 2.07% loss, but it may have been given a temporary reprieve because many of the overseas markets were closed by the time the Fed delivered his message.

You can see the updated I-fund and other TSP share prices and returns, usually posted daily by 8:30 PM ET here: https://www.tsptalk.com/tsp_share_prices.php
Thanks so much for reading! We'll see you back here tomorrow.
Tom Crowley
Read more in today's TSP Talk Plus Report. We post more charts, indicators and analysis, plus discuss the allocations of the TSP and ETF Systems. For more information on how to gain access and a list of the benefits of being a subscriber, please go to: www.tsptalk.com/plus.php
Questions, comments, or issues with today's commentary? We can discuss it in the Forum.
Daily Market Commentary Archives
For more info our other premium services, please go here... www.tsptalk.com/premiums.php
To get weekly or daily notifications when we post new commentary, sign up HERE.
Posted daily at www.tsptalk.com/comments.php
The legal stuff: This information is for educational purposes only! This is not advice or a recommendation. We do not give investment advice. Do not act on this data. Do not buy, sell or trade the funds mentioned herein based on this information. We may trade these funds differently than discussed above. We use additional methods and strategies to determine fund positions.
Last edited:


