Stocks were mostly flat on Friday after a morning rally quickly lost steam. The PPI report came in hotter than expected sending yields up yet again as inflation continues to hang around and that could put pressure on the Fed to stop cutting rates. This is giving the bears some ammunition in a market where stock valuations are quite high. Can the bullish seasonality overcome this?

If the Fed is done cutting rates the bulls lose some of their ammunition, but there is one more cut coming - most likely - this week and that's something.
Combine that with the valuation of the S&P 500 which, at 25 times earnings, is near the top of its all-time range, and there is some reason to be concerned. Investors who don't like risky situations may be looking to lock in some profits.
However, we've already had a little pull back heading into a very strong period for stocks. And, according to this X post --
"The coming 3-week period is historically THE ABSOLUTE BEST performing weeks of any market cycle/period, historically. Election fund flow year-end chase, Santa Claus Rally period, and First 5 Days of January."

And here is the S&P 500 Equal Weighted S&P 500 ETF chart, which just experienced another normal pullback in its ascending trading channel. If this breaks, then the bears have some fodder for a negative outcome, otherwise it may business as usual for the bulls, with a seasonal advantage going forward to boot.

Chart source: https://x.com/FrankCappelleri
Here is the current December chart for the S&P 500, followed by the prior 6 election year December charts. All ended the month positive - some much better than others, and most were quite choppy so the bulls may need some patience.

Bitcoin has been a good sentiment indicator and it was trading at an all-time high over 105,000 last I checked. As I have been saying, this is a pretty good indication of investors' appetite for risky assets, which is bullish sign. At extreme levels it can be a sign of complacency but bitcoin was within a whisper of 100K for the first time 3+ weeks ago, so it has been consolidating sideways since then, and it's not a runaway chart. However, it is in an "F" flag, which can rally for a while, but they do tend to eventually break down - unless it can break through the top first, which it was trying to do last night.

The FOMC meeting starts tomorrow and concludes on Wednesday with a policy statement and decision on interest rates at 2 PM ET, and then a Jerome Powell presser shortly afterward.
The S&P 500 (C-fund) has been cracking recent days but we knew if there was going to be a year end run for the bulls, the middle of the month could see some profit taking first. There is some support just below and that 6000 - 6025 area needs to hold or the next level of support is more than 100-points lower. One big concern is...

The Dow Transportation Index, considered one of the major market leaders, is now testing its post Election Day open gap. If the other indices are planning to follow, they have a long way to fall. If that 16,600 near the bottom of the gap can hold and then it rebounds, perhaps the followers can hold up as well. That's not analysis - it's wishful thinking from a bull.
DWCPF (S-fund) fell below one of its ascending channels and there's a bunch support below which now becomes a target for this pullback. Right now this looks like a healthy retreat to regain strength for another move up, but if the Fed disappoints and takes lower rates out of the equation, then small caps could suffer.

ACWX (The I-fund tracking index) was down 0.20% on Friday, the I-fund was given a 0.25% loss. It's retesting an old gap that was already filled and some rising support so a rally today would be very welcomed by the I-fund bulls. A retest of the lows wouldn't be horrible, but it would be happening during a time that we wouldn't expect that.

You can see the updated I-fund and other TSP share prices and returns, usually posted daily by 8:30 PM ET here: https://www.tsptalk.com/tsp_share_prices.php
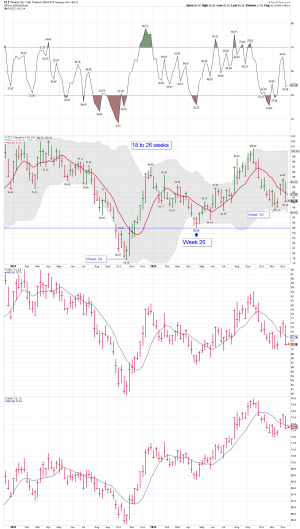
BND (bonds / F-fund) continues to sink as yields rise. This once promising chart looks very similar to the I-fund chart above, and it needs some help. If yields are rising because the economy is picking up steam, that is a better reason for the stock market than because inflation is getting warm again.

Thanks so much for reading! We'll see you back here tomorrow.
Tom Crowley
Read more in today's TSP Talk Plus Report. We post more charts, indicators and analysis, plus discuss the allocations of the TSP and ETF Systems. For more information on how to gain access and a list of the benefits of being a subscriber, please go to: www.tsptalk.com/plus.php
Questions, comments, or issues with today's commentary? We can discuss it in the Forum.
Daily Market Commentary Archives
For more info our other premium services, please go here... www.tsptalk.com/premiums.php
To get weekly or daily notifications when we post new commentary, sign up HERE.
Posted daily at www.tsptalk.com/comments.php
The legal stuff: This information is for educational purposes only! This is not advice or a recommendation. We do not give investment advice. Do not act on this data. Do not buy, sell or trade the funds mentioned herein based on this information. We may trade these funds differently than discussed above. We use additional methods and strategies to determine fund positions.

| Daily TSP Funds Return
More returns |
Yields are on the move again and the inflation data is making investors nervous. It's not serious like in prior years, but the 10-year Treasury Yield has been moving in the wrong direction for the last week. Not that it can't go up, but we certainly don't want to see it making new highs anytime soon. 4.4% is getting closer to the top of the recent range, and the 2-year yield is at 4.25%, so if the Fed cuts this week, and last I checked over the weekend the chances of a Fed rate cut this week is 96%, they would be basically in line with the 2-year yield so that may very well be the end interest cuts.
If the Fed is done cutting rates the bulls lose some of their ammunition, but there is one more cut coming - most likely - this week and that's something.
Combine that with the valuation of the S&P 500 which, at 25 times earnings, is near the top of its all-time range, and there is some reason to be concerned. Investors who don't like risky situations may be looking to lock in some profits.
However, we've already had a little pull back heading into a very strong period for stocks. And, according to this X post --
"The coming 3-week period is historically THE ABSOLUTE BEST performing weeks of any market cycle/period, historically. Election fund flow year-end chase, Santa Claus Rally period, and First 5 Days of January."

And here is the S&P 500 Equal Weighted S&P 500 ETF chart, which just experienced another normal pullback in its ascending trading channel. If this breaks, then the bears have some fodder for a negative outcome, otherwise it may business as usual for the bulls, with a seasonal advantage going forward to boot.

Chart source: https://x.com/FrankCappelleri
Here is the current December chart for the S&P 500, followed by the prior 6 election year December charts. All ended the month positive - some much better than others, and most were quite choppy so the bulls may need some patience.

Bitcoin has been a good sentiment indicator and it was trading at an all-time high over 105,000 last I checked. As I have been saying, this is a pretty good indication of investors' appetite for risky assets, which is bullish sign. At extreme levels it can be a sign of complacency but bitcoin was within a whisper of 100K for the first time 3+ weeks ago, so it has been consolidating sideways since then, and it's not a runaway chart. However, it is in an "F" flag, which can rally for a while, but they do tend to eventually break down - unless it can break through the top first, which it was trying to do last night.

The FOMC meeting starts tomorrow and concludes on Wednesday with a policy statement and decision on interest rates at 2 PM ET, and then a Jerome Powell presser shortly afterward.
The S&P 500 (C-fund) has been cracking recent days but we knew if there was going to be a year end run for the bulls, the middle of the month could see some profit taking first. There is some support just below and that 6000 - 6025 area needs to hold or the next level of support is more than 100-points lower. One big concern is...

The Dow Transportation Index, considered one of the major market leaders, is now testing its post Election Day open gap. If the other indices are planning to follow, they have a long way to fall. If that 16,600 near the bottom of the gap can hold and then it rebounds, perhaps the followers can hold up as well. That's not analysis - it's wishful thinking from a bull.
DWCPF (S-fund) fell below one of its ascending channels and there's a bunch support below which now becomes a target for this pullback. Right now this looks like a healthy retreat to regain strength for another move up, but if the Fed disappoints and takes lower rates out of the equation, then small caps could suffer.

ACWX (The I-fund tracking index) was down 0.20% on Friday, the I-fund was given a 0.25% loss. It's retesting an old gap that was already filled and some rising support so a rally today would be very welcomed by the I-fund bulls. A retest of the lows wouldn't be horrible, but it would be happening during a time that we wouldn't expect that.

You can see the updated I-fund and other TSP share prices and returns, usually posted daily by 8:30 PM ET here: https://www.tsptalk.com/tsp_share_prices.php
BND (bonds / F-fund) continues to sink as yields rise. This once promising chart looks very similar to the I-fund chart above, and it needs some help. If yields are rising because the economy is picking up steam, that is a better reason for the stock market than because inflation is getting warm again.

Thanks so much for reading! We'll see you back here tomorrow.
Tom Crowley
Read more in today's TSP Talk Plus Report. We post more charts, indicators and analysis, plus discuss the allocations of the TSP and ETF Systems. For more information on how to gain access and a list of the benefits of being a subscriber, please go to: www.tsptalk.com/plus.php
Questions, comments, or issues with today's commentary? We can discuss it in the Forum.
Daily Market Commentary Archives
For more info our other premium services, please go here... www.tsptalk.com/premiums.php
To get weekly or daily notifications when we post new commentary, sign up HERE.
Posted daily at www.tsptalk.com/comments.php
The legal stuff: This information is for educational purposes only! This is not advice or a recommendation. We do not give investment advice. Do not act on this data. Do not buy, sell or trade the funds mentioned herein based on this information. We may trade these funds differently than discussed above. We use additional methods and strategies to determine fund positions.


