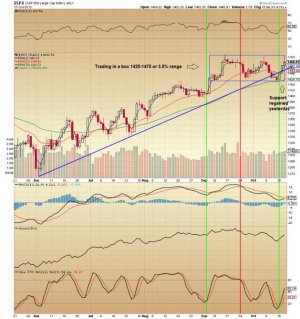
The SP 500 on the daily chart has been trading in a box since early September, within a 3.5% range. One can also count five waves. Call it a reelection tussle, a holding pattern, indecision, a basing pattern for a move up or a topping pattern. It should be noted that support from the June low was regained yesterday, after trading below the line four sessions. Most metrics are moving back up. Will this be the breakout above 1475 this time, or another decline as soon as option expiration week is over? My contrarian indicator shows too much bearish sentiment, which should be bullish in the short term. My risk on/off indicator is green in the short term. There are 14 points (1%) to go to clear the box. However, many weekly charts are showing stiff resistance has been reached. Oh, decisions!


