Sunday Brief, 22 August 2010
Where there's smoke...1056 is fire
Where there's smoke...1056 is fire
The week started out great, then ended with a thud. It is what it is, the Bears have been gaining ground in the news and on the blogs, while our governments statistics are backing up their claims. I don't know where sentiment is, but my perception of bearish sentiment is spiking to all time highs. As a result, my expectations for the remainder of the year have been lowered.
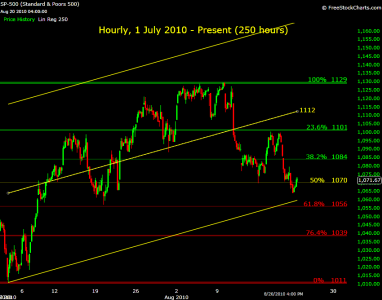
On the hourly July rising channel, it's oversold, while Fibonacci is at 50%. In the past I've spoken about 1084 & 1069, and unfortunately we've broken through both those levels. I believe this chart is Neutral with a bearish bias and it wants to test 1056.
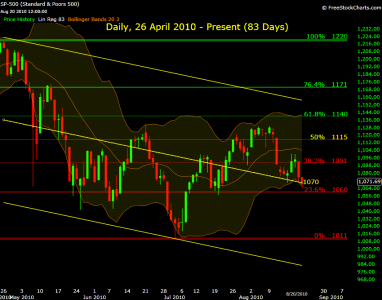
The daily channel is priced "on target" while the Mr. Fibonacci is bearish with an impending test of 1060. As Ira says, when you pierce the bottom of a bollinger band, it's not a time to buy, it's a time to take profits by exiting your shorts.
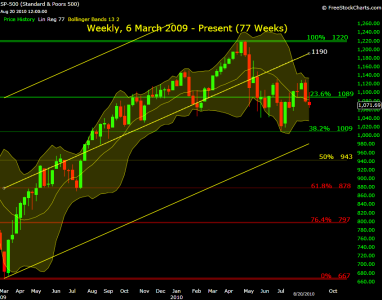
The weekly Fibonacci levels will stay bullish unless we break through 1009. Meanwhile the channel is halfway between "on target" and "oversold." The Bollinger bands are bearish suggesting a test of 1033.
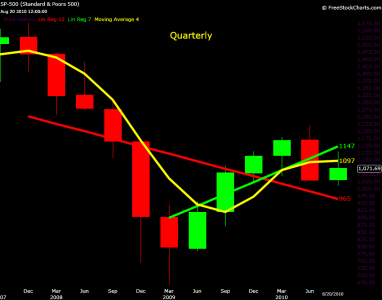
I won't go too much into the monthly chart since the candlestick hasn't closed yet. But I do want to point out one important thing we should be watching for. This could be the third month we've closed below the 50% retracement from the October 2007 Bull market peak.
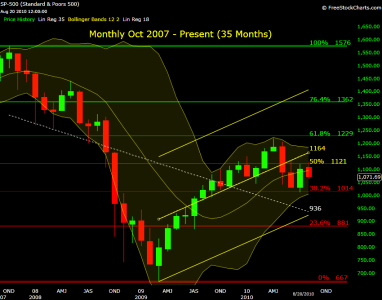
On the long-term view, it's important to take note of the price difference between the previous bull/bear market. The median price between 1147 to 965 is 1056. Since we are already trading below the 4SMA (yearly average) my personal thoughts are 1056 is a valid line in the sand between the current bull/bear fight.
That's all I have, it's been a stressful week on this forum, so expect me to lay low. I will be looking for an exit this week if it's presented to me.
Take care and trade safe...Jason
