Stock Watch

JTH

Well-known member
Interesting stock showing a good tug-of war with price

1) 9 Oct 2013 bounce off 200 SMA generates $4.63 gain, establishing the anchor for the 6-month trendline
2) 3 Feb 2014 bounce off 200 SMA generates $2.68 gain, establishing the low from which the trendline is created
3) Multiple levels of support & resistance at 14.50 & 15.50
4) Consecutive ramp-up in negative volume over the past 6 days
5) Close below the outer Bollinger Bands which are compressed but expanding, indicating an impending volatile move
6) Close just under the 6-month trendline
7) Price is hovering in the area of 2 major tops from May & July 2013 and a major gap-up-top from Oct 2013
8) Open 26 cent gap fill @ 17.61

All-in-all this looks like a great setup for a short, but if it can bounce & breach the 20 SMA, 50 SMA and the previous $16.21 7-Mar top. From $16.21 there is a $1.40/8.64% gain to the 17.61 gap fill or a $2.29/14.13% gain to the previous $18.50 high. After that, it's uncharted territory.

View attachment 27616
 
Potential Head & Shoulders pattern emerging

1) Left Shoulder's price range is greater than 50% of the Head
2) Left Shoulder's Volume is higher than the Head & Right Shoulder
3) Right Shoulder's price range is greater than 50% of the Head
4) The Head is at a 5-month high which had filled a $0.54 cent -19.54% gap

A) Pattern's Price Objective is $1.25 I don't know it will go that deep, 50-75% of the Price objective seems more reasonable, say $1.70 - $1.46
B) The Right Shoulder has a slight M pattern and closed outside the Bollinger Bands, I'd like to see a fake bounce before breaching the Neckline
C) A breach of the Neckline should be accompanied with a surge is volume
D) If an entry were taken, I'd consider an exit at the Neckline

View attachment 27617
 
Another potential Head & Shoulders pattern emerging, this one has breached the Neckline

1) Left Shoulder's price range is greater than 50% of the Head
2) Left Shoulder's Volume is higher than the Head & Right Shoulder
3) Right Shoulder's price range is greater than 50% of the Head

A) Pattern's Price Objective is $1.61 with 50-75% of the Price objective from $1.91 - $1.76
B) The Right Shoulder has a slight M pattern and is near the bottom Bollinger Bands below the Neckline
C) The breach of the Neckline is accompanied with a surge is volume
D) If an entry were taken, from 1.76 it would be a $.44 cent 25.10% rise to the Neckline

View attachment 27634
 
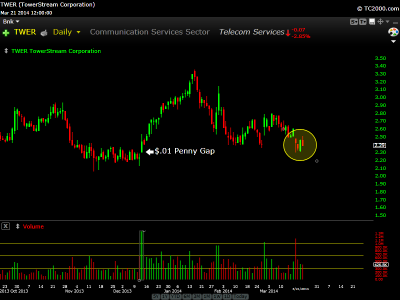
Potential Gap Play

1) Today's close filled a $.01 cent gap from 64 days ago
2) Today's close created a double gap, partially jumping the previous $.06 cent gap from 13 days ago
3) Today's close at $2.43 left a $.03 cent open gap that will get filled at $2.51 (a range of $.08 cents) this will close the double gap
4) Today's range breached the bottom Bollinger Band but closed within the channel
5) Today's candlestick put in a Hammer (or a bottoming tail/spike low)
6) Today's Hammer was accompanied with a 63-day high in Volume (only outdone by the volume on the $.01 cent gap day)

A) Support: Over the past 28 days the $2.41 price level has been breached 8 times, yet failed to close at or below this level
B) Resistance: Both the 20 SMA & 200 SMA reside at $2.60
C) Price Range: The 200 ATR (Average True Range over 200 days) is $.13 cents
C) Potential: a 50% retracement from the previous $2.80 top to today's $2.30 low is $2.55 from the current $2.43 level this is a $.12 cent gain

View attachment 27651


Hourly Chart: If I were able to give this trade my undivided attention, I would enter at $2.44 and attempt to ride it up to $2.53

View attachment 27652
 
Interesting stock showing a good tug-of war with price

1) 9 Oct 2013 bounce off 200 SMA generates $4.63 gain, establishing the anchor for the 6-month trendline
2) 3 Feb 2014 bounce off 200 SMA generates $2.68 gain, establishing the low from which the trendline is created
3) Multiple levels of support & resistance at 14.50 & 15.50
4) Consecutive ramp-up in negative volume over the past 6 days
5) Close below the outer Bollinger Bands which are compressed but expanding, indicating an impending volatile move
6) Close just under the 6-month trendline
7) Price is hovering in the area of 2 major tops from May & July 2013 and a major gap-up-top from Oct 2013
8) Open 26 cent gap fill @ 17.61

All-in-all this looks like a great setup for a short, but if it can bounce & breach the 20 SMA, 50 SMA and the previous $16.21 7-Mar top. From $16.21 there is a $1.40/8.64% gain to the 17.61 gap fill or a $2.29/14.13% gain to the previous $18.50 high. After that, it's uncharted territory.

View attachment 27616

We have an exact double bottom at 13.18 accompanied with heavy volume and a recent $.38 cent gap

View attachment 27666
 
03-17-2014, 08:43 PM
Another potential Head & Shoulders pattern emerging, this one has breached the Neckline

1) Left Shoulder's price range is greater than 50% of the Head
2) Left Shoulder's Volume is higher than the Head & Right Shoulder
3) Right Shoulder's price range is greater than 50% of the Head

A) Pattern's Price Objective is $1.61 with 50-75% of the Price objective from $1.91 - $1.76
B) The Right Shoulder has a slight M pattern and is near the bottom Bollinger Bands below the Neckline
C) The breach of the Neckline is accompanied with a surge is volume
D) If an entry were taken, from 1.76 it would be a $.44 cent 25.10% rise to the Neckline

Today's low $1.91 the minimum price objective met, check out the surge in today's volume, I'll be curious to see where this bottoms out.

View attachment 27670
 
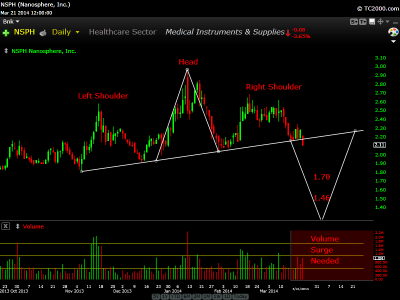
Potential Head & Shoulders pattern emerging

1) Left Shoulder's price range is greater than 50% of the Head
2) Left Shoulder's Volume is higher than the Head & Right Shoulder
3) Right Shoulder's price range is greater than 50% of the Head
4) The Head is at a 5-month high which had filled a $0.54 cent -19.54% gap

A) Pattern's Price Objective is $1.25 I don't know it will go that deep, 50-75% of the Price objective seems more reasonable, say $1.70 - $1.46
B) The Right Shoulder has a slight M pattern and closed outside the Bollinger Bands, I'd like to see a fake bounce before breaching the Neckline
C) A breach of the Neckline should be accompanied with a surge is volume
D) If an entry were taken, I'd consider an exit at the Neckline

Update: The Neckline has been breached and it's accompanied with heavy volume

NSPH-1.png
 
Potential Gap Play

1) Today's close filled a $.01 cent gap from 64 days ago
2) Today's close created a double gap, partially jumping the previous $.06 cent gap from 13 days ago
3) Today's close at $2.43 left a $.03 cent open gap that will get filled at $2.51 (a range of $.08 cents) this will close the double gap
4) Today's range breached the bottom Bollinger Band but closed within the channel
5) Today's candlestick put in a Hammer (or a bottoming tail/spike low)
6) Today's Hammer was accompanied with a 63-day high in Volume (only outdone by the volume on the $.01 cent gap day)

A) Support: Over the past 28 days the $2.41 price level has been breached 8 times, yet failed to close at or below this level
B) Resistance: Both the 20 SMA & 200 SMA reside at $2.60
C) Price Range: The 200 ATR (Average True Range over 200 days) is $.13 cents
C) Potential: a 50% retracement from the previous $2.80 top to today's $2.30 low is $2.55 from the current $2.43 level this is a $.12 cent gain

Hourly Chart: If I were able to give this trade my undivided attention, I would enter at $2.44 and attempt to ride it up to $2.53

$2.51 Gap Filled (the trade is complete)

TWER - 3.png
 
Potential Head & Shoulders pattern emerging

1) Left Shoulder's price range is greater than 50% of the Head
2) Left Shoulder's Volume is higher than the Head & Right Shoulder
3) Right Shoulder's price range is greater than 50% of the Head
4) The Head is at a 5-month high which had filled a $0.54 cent -19.54% gap

A) Pattern's Price Objective is $1.25 I don't know it will go that deep, 50-75% of the Price objective seems more reasonable, say $1.70 - $1.46
B) The Right Shoulder has a slight M pattern and closed outside the Bollinger Bands, I'd like to see a fake bounce before breaching the Neckline
C) A breach of the Neckline should be accompanied with a surge is volume
D) If an entry were taken, I'd consider an exit at the Neckline

Update: The Neckline has been breached and it's accompanied with heavy volume

Still keeping my eye on this Head & Shoulders pattern, over the past 2 days it's tried to get back above the neckline but failed both times.

View attachment 27783
 
Back
Top