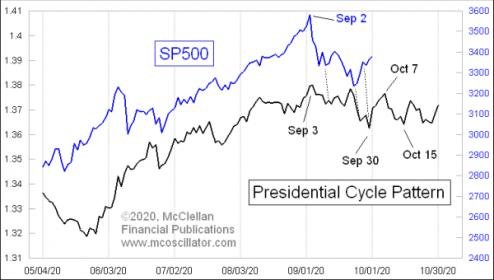
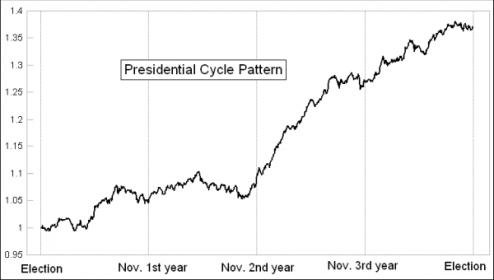
Presidential Cycle Pattern

It's all about the third year in the presidential cycle.

As the next election looms, however, the model suggests that presidents focus on shoring up the economy in order to get re-elected. As a result, the major stock market indices are more likely to gain in value. According to the theory, the results are fairly consistent, regardless of the president’s political leanings.

https://www.investopedia.com/terms/p/presidentialelectioncycle.asp

It last worked in Trump's third year which marked a 28.9% raise in the S&P 500.

Biden is in his third year right now.
 
Third year turned out pretty good. What's the fourth year (election) prediction?

Historically, the large-cap U.S. equity benchmark SPX has seen its performance in the first five trading days and over the full year correlate in the same direction 69% of the time, based on Dow Jones Market Data going back to 1950. In election years, that correlation took place 83% of the time. The trend has also held true in eight of the last 12 years, and in 14 of the last 16 presidential election years.

This year, the S&P 500 is on pace to log a 1.8% decline over its first four trading days, according to FactSet data. The last time the index fell 1% or more in its first five trading days of the year, in 2022, it lost 19.44% for the full year.

The S&P 500’s first five trading days may indicate full-year performance. That doesn’t bode well for stocks in 2024.
 

I think "In theory it should be a good year for the cycle. I did pick up a copy of the latest Stock Trader's Almanac, but I haven't read it yet.

My only concern, is I wonder how this will play out (timing wise) with both rate cuts (how many and when) and then how contentious this Presidential election will be.
 
Back
Top