10/27/25
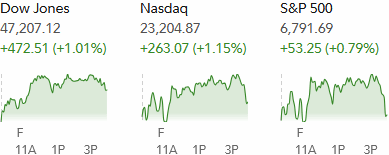
The CPI data came in on the inflationary side on Friday, but it was below expectations, and that was good enough for the stock market to rally and move to new highs. There was some late selling heading into the weekend, which is concerning but not surprising, but the indices were able to close with solid gains and at all times highs, so the bulls remain in charge.
With the CPI data out of the way, there should be no question that the Federal Reserve will be cutting interest rates at Wednesday's meeting. Interest rates are coming down, the Fed is putting an end quantitative tightening so the loosening of monetary policies is a bullish door opening for the stock market, despite some concerns about valuations.
At some point valuations will burn the market, but barring any major geopolitical event, pandemic, calamity, etc., the set up is here for the stock market to keep its bullish trend alive.
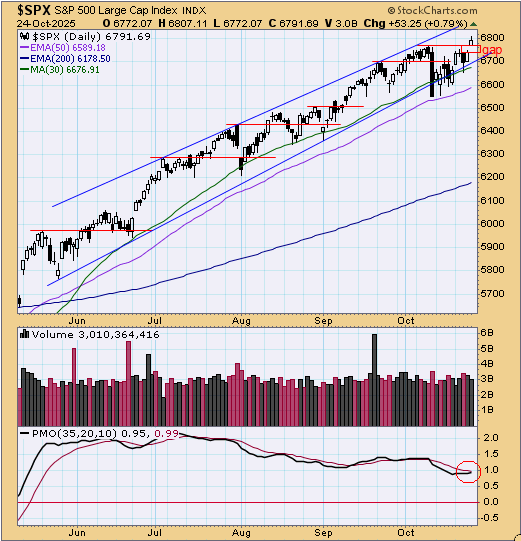
The S&P 500 (C-fund) broke out to new highs after its recent test of the lower end of the blue trading channel, and technically that channel broke but the 50-day moving average did a good job of catching the fall. The horizontal lines below show that other breakouts to new highs doesn't mean the index is going straight up. That could be a gap and go, but there's a good chance that it will, at some point, retest that breakout line, and in many prior cases come below that line before resuming higher. So, for the market timers who feel they missed the boat, there could very like be another chance to buy a pullback. The caveat -- even though stocks did very well over the past six months, seasonality actually gets much more bullish starting this week and heading into the end of the year.
The gap was opened on Friday after the release of the CPI report before the opening bell, and while they are difficult to see because they were filled so quickly, gaps have been getting filled and we had a big one at Thursday's closing price of 6738.
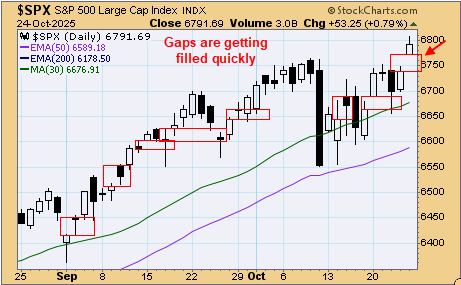
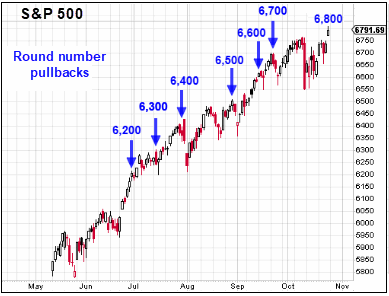
Another interesting pattern is that we have seen the S&P 500 pause and dip slightly to moderately after taking out another round number on the index. On Friday the S&P topped 6800 for the first time before pulling back late and closing at 6792. Again, seasonality could make it different this time.
The 10-year Treasury Yield was up slightly on Friday but couldn't quite close above 4%. Again, above or below 4% isn't the issue, it's how quickly it moves as stabilization is more bullish for the stock market than a low yield.
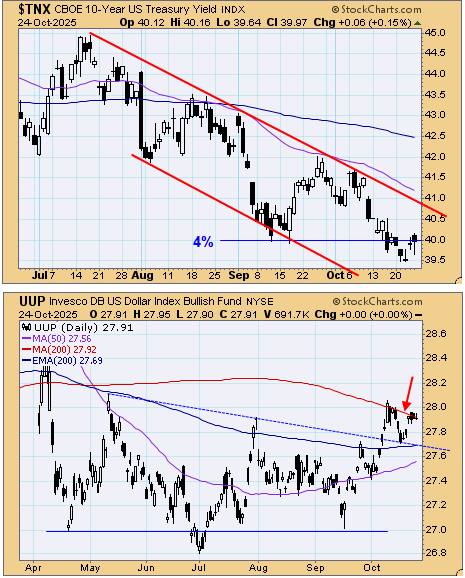
The dollar (UUP) is continuing to put pressure on that 200-day simple moving average. This looks like it wants to move higher, which could hurt the I-fund, but it has been in a range and could roll over at that resistance again, so it's hard to say until it decides whether it wants to move above the red line, or fall below the blue support line and 200-day EMA.
We have some key economic data this week with the PCE Prices data on Friday, but the highlight is the 2-day FOMC meeting which ends on Wednesday when we'll get the Fed's decision on interest rates. We also have some Mag 7 companies reporting earnings this week.
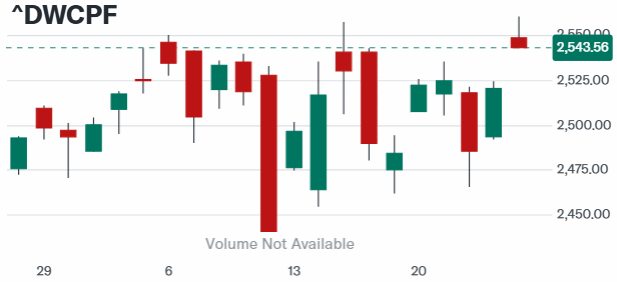
For some reason, my normal chart service did not update the DWCPF Index (S-Fund) chart so I had to use a Yahoo chart today. The index did breakout to new highs, but it also closed at the lows of the day as it looks to be headed to trying to fill in that open gap. That's fine, as long as the old highs don't hold it back again.
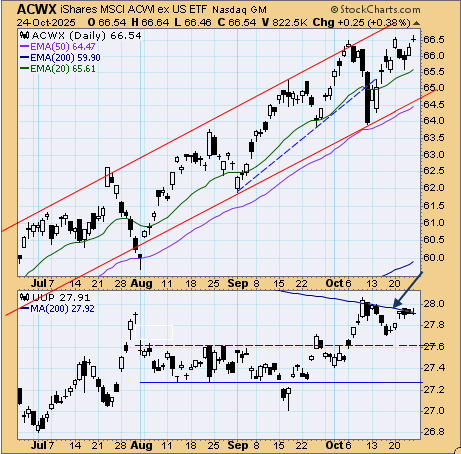
ACWX (I-fund) also made a new high but closed weakly heading into the weekend. The dollar continues to push on that moving average, and if it breaks out, the I-fund could start underperforming the other US funds, but I've been saying that for weeks and so far that hasn't really happened as the I-fund leads in October again.
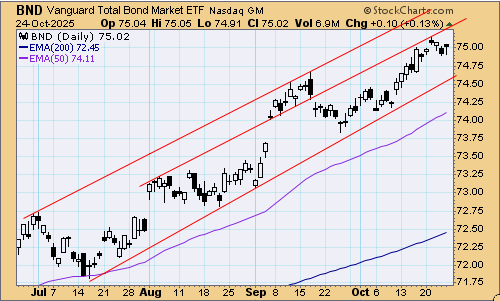
BND (bonds / F-fund) was up slightly despite a tick up in yields on Friday. The trend is up and it is trading almost in the middle of the outer red channel, so there is room for this to wiggle on either side in the short term.
Thanks so much for reading! We'll see you back here tomorrow.
Tom Crowley
Read more in today's TSP Talk Plus Report. We post more charts, indicators and analysis, plus discuss the allocations of the TSP and ETF Systems. For more information on how to gain access and a list of the benefits of being a subscriber, please go to: www.tsptalk.com/plus.php

Questions, comments, or issues with today's commentary? We can discuss it in the Forum.
Daily Market Commentary Archives
For more info our other premium services, please go here... www.tsptalk.com/premiums.php
To get weekly or daily notifications when we post new commentary, sign up HERE.
Posted daily at www.tsptalk.com/comments.php
The legal stuff: This information is for educational purposes only! This is not advice or a recommendation. We do not give investment advice. Do not act on this data. Do not buy, sell or trade the funds mentioned herein based on this information. We may trade these funds differently than discussed above. We use additional methods and strategies to determine fund positions.
The CPI data came in on the inflationary side on Friday, but it was below expectations, and that was good enough for the stock market to rally and move to new highs. There was some late selling heading into the weekend, which is concerning but not surprising, but the indices were able to close with solid gains and at all times highs, so the bulls remain in charge.
| Daily TSP Funds Return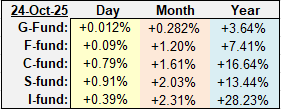
More returns |
With the CPI data out of the way, there should be no question that the Federal Reserve will be cutting interest rates at Wednesday's meeting. Interest rates are coming down, the Fed is putting an end quantitative tightening so the loosening of monetary policies is a bullish door opening for the stock market, despite some concerns about valuations.
At some point valuations will burn the market, but barring any major geopolitical event, pandemic, calamity, etc., the set up is here for the stock market to keep its bullish trend alive.
The S&P 500 (C-fund) broke out to new highs after its recent test of the lower end of the blue trading channel, and technically that channel broke but the 50-day moving average did a good job of catching the fall. The horizontal lines below show that other breakouts to new highs doesn't mean the index is going straight up. That could be a gap and go, but there's a good chance that it will, at some point, retest that breakout line, and in many prior cases come below that line before resuming higher. So, for the market timers who feel they missed the boat, there could very like be another chance to buy a pullback. The caveat -- even though stocks did very well over the past six months, seasonality actually gets much more bullish starting this week and heading into the end of the year.

The gap was opened on Friday after the release of the CPI report before the opening bell, and while they are difficult to see because they were filled so quickly, gaps have been getting filled and we had a big one at Thursday's closing price of 6738.

Another interesting pattern is that we have seen the S&P 500 pause and dip slightly to moderately after taking out another round number on the index. On Friday the S&P topped 6800 for the first time before pulling back late and closing at 6792. Again, seasonality could make it different this time.

The 10-year Treasury Yield was up slightly on Friday but couldn't quite close above 4%. Again, above or below 4% isn't the issue, it's how quickly it moves as stabilization is more bullish for the stock market than a low yield.

The dollar (UUP) is continuing to put pressure on that 200-day simple moving average. This looks like it wants to move higher, which could hurt the I-fund, but it has been in a range and could roll over at that resistance again, so it's hard to say until it decides whether it wants to move above the red line, or fall below the blue support line and 200-day EMA.
We have some key economic data this week with the PCE Prices data on Friday, but the highlight is the 2-day FOMC meeting which ends on Wednesday when we'll get the Fed's decision on interest rates. We also have some Mag 7 companies reporting earnings this week.
For some reason, my normal chart service did not update the DWCPF Index (S-Fund) chart so I had to use a Yahoo chart today. The index did breakout to new highs, but it also closed at the lows of the day as it looks to be headed to trying to fill in that open gap. That's fine, as long as the old highs don't hold it back again.

ACWX (I-fund) also made a new high but closed weakly heading into the weekend. The dollar continues to push on that moving average, and if it breaks out, the I-fund could start underperforming the other US funds, but I've been saying that for weeks and so far that hasn't really happened as the I-fund leads in October again.

BND (bonds / F-fund) was up slightly despite a tick up in yields on Friday. The trend is up and it is trading almost in the middle of the outer red channel, so there is room for this to wiggle on either side in the short term.

Thanks so much for reading! We'll see you back here tomorrow.
Tom Crowley
Read more in today's TSP Talk Plus Report. We post more charts, indicators and analysis, plus discuss the allocations of the TSP and ETF Systems. For more information on how to gain access and a list of the benefits of being a subscriber, please go to: www.tsptalk.com/plus.php
Questions, comments, or issues with today's commentary? We can discuss it in the Forum.
Daily Market Commentary Archives
For more info our other premium services, please go here... www.tsptalk.com/premiums.php
To get weekly or daily notifications when we post new commentary, sign up HERE.
Posted daily at www.tsptalk.com/comments.php
The legal stuff: This information is for educational purposes only! This is not advice or a recommendation. We do not give investment advice. Do not act on this data. Do not buy, sell or trade the funds mentioned herein based on this information. We may trade these funds differently than discussed above. We use additional methods and strategies to determine fund positions.

