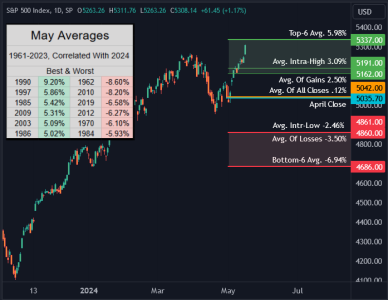
May Trading Day 11 Closed 5.41% MTD, the 2nd Best Since 1990's 7.10% Trd-Dy-11

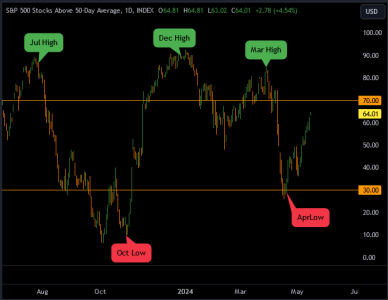
The number of S&P 500 stocks above the 50-Day Moving Average rides at 64%.
The Monthly Highs & Lows highlighted are where the S&P 500 peaked and bottomed.

I would estimate, if there were to be a pullback, the most likely area would be just before or after the Memorial Day weekend. At the same time, while I still have some stats to crunch for June, I see no historical data to support a pullback.

The number of S&P 500 stocks above the 50-Day Moving Average rides at 64%.
The Monthly Highs & Lows highlighted are where the S&P 500 peaked and bottomed.

I would estimate, if there were to be a pullback, the most likely area would be just before or after the Memorial Day weekend. At the same time, while I still have some stats to crunch for June, I see no historical data to support a pullback.
