Indicators have gone green

MrJohnRoss

Well-known member
Just moved from G/F to C/S/I. See the following chart:
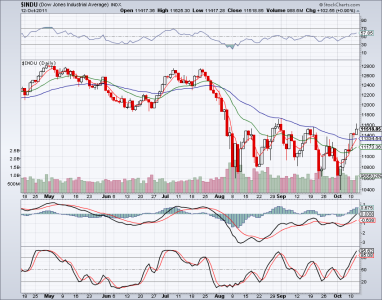


dow 10-12-11.png


Stochastics (bottom) and PPO (middle) heading higher. (Just like a gas pedal & tachometer in your car).

Relative speed of car is the actual price action. All heading higher. Moving averages are significant as well.

Relatively weak breakout today, but enough to confirm my signal.

I know that a full global financial collapse could come at any time, but I cannot, and will not, argue with price action.

It remains to be seen how long this uptrend lasts, but for now, I've jumped back on board.

This makes trade number 6 for the year.

I'll use another post for another time for the reason for going C/S/I. Normally I go 100% S, but not this time.

Hope this helps!
 
Just moved from G/F to C/S/I. See the following chart:


View attachment 15739


Stochastics (bottom) and PPO (middle) heading higher. (Just like a gas pedal & tachometer in your car).

Relative speed of car is the actual price action. All heading higher. Moving averages are significant as well.

Relatively weak breakout today, but enough to confirm my signal.

I know that a full global financial collapse could come at any time, but I cannot, and will not, argue with price action.

It remains to be seen how long this uptrend lasts, but for now, I've jumped back on board.

This makes trade number 6 for the year.

I'll use another post for another time for the reason for going C/S/I. Normally I go 100% S, but not this time.

Hope this helps!
I'm not disagreeing, but rather playing devil's advocate... Can you explain how this is different than the action in late August when the indicators and price action looked very similar?

For the record, I would be a buyer if I had to hold until the end of the year, but since I am out of IFT's in October I'm hoping the market holds off for a couple of weeks. :)

101311c.gif
 
i think i just had an epiphany.

note to self: self, if i ever get on a carnival ride and i'm there in the next seat grinning, get off!

still ridin, hell why not, i already paid for the ticket.
 
It has seemed to work for him so far... :D

Thank you RealMoneyIssues.

burrocat: Since 2007 (when I started my Timing System) the S&P 500 has a cumulative return of -18.5% (as of the end of last week).

My Timing System has had a cumulative return of 82.5%. Not trying to brag, just providing my statistics.

Have there been periods of mediocre performance? Yes.

Have I lost money on any trades? Yes.

I tend to think long term. As long as the bulk of my trades are successful, and I'm beating the market consistently over time, I consider my system to work pretty well.

If I could invent the "perfect system" (the crystal ball) I'd already be sipping pina coladas on the beach by now.

Instead, it's two steps forward, and an occasional step back.

Let's see how this plays out in real time. This is a pretty weak breakout, so we'll just have to wait and see if it pans out or not.

In the meantime, feel free to comment on my system, even if a trade goes bad.

We're all here to learn together. I'll tell you the truth, and I won't hide from my mistakes.
 
Last edited:
roger that. welcome aboard.

there's always more room for bulls on this train.

whooo, hoooo.

i'd say wheeee, wheeee, but it tends to make Jim buy more scotch.

not that there's anything wrong with that, it helps sometimes, but i'm stuck here good.

and i'm gonna get it back.
 
I'm not disagreeing, but rather playing devil's advocate... Can you explain how this is different than the action in late August when the indicators and price action looked very similar?

Great question tsptalk.

The August breakout was close, but failed to penetrate the 50 EMA. Normally I chart the $SPX, but I also like to look at the Dow, Transports, and NASDAQ charts to confirm.

We need to break above 11,613 on the Dow to confirm. Maybe the bombshell earnings report from Google will blast the market higher tomorrow. $2.7 Billion in earnings in 3 months is mind blowing.
 
Back
Top