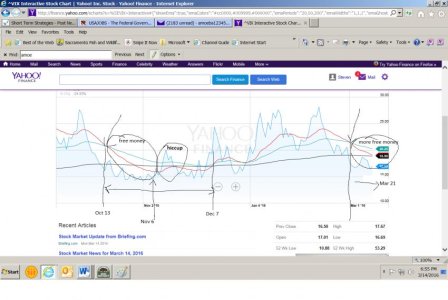
Would you look at that:
Oil down and market mixed. FED to announce rate (non-) decision this week. Options expirations could/should amplify upward move. And, for those who didn't read my other chart, here is my latest attempt to graphically explain my thinking on the subject title of this post; as it mirrors a recent crossover of the ^VIX 20 and 50 EMAs last q4. This is early in the repeating trend, before the 50 and 200 EMAs cross; if that happens (and it well might - or maybe not) it could extend the money grab to May 1. As of now, I see safety in equity funds through ~3/21.16.
IOW, for free money - buy equities now. All aboard!


