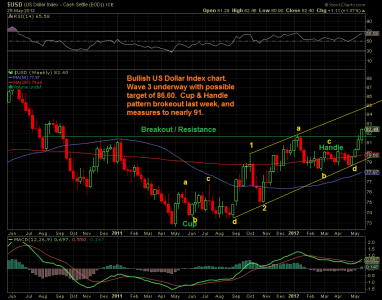
The bullish US Dollar Index shows no signs of slowing. The weekly chart below indicates a cup & handle pattern that has been forming since the start of 2011. For many weeks there was a descent to form the left side of the cup. The bottom was put in place between May-September of 2011. The right side of the cup is choppy, and the top of the handle, at 81.78, was put in place the first week of January, 2012. A pull-back ensued forming the handle. We have seen a quick rise in the last three weeks passing the breakout point at the top of the handle at the close of last week. The pattern now measures to nearly 91.
Counting the waves from the bottom of the cup, suggests that wave three is underway, with a target of 86.60. Wave three’s are generally very strong, so the strength of the move suggests that the count is correct. You can also see an up trending channel. When wave three is finished, a wave four pullback will occur, and then wave five will presumably finish near 91. This should exceed the high of 88.71 made in June 2010.
So what does this chart suggest? Generally during periods of rapid US Dollar Index decline the market has done well, but during periods of rapid rise the market has declined. So, based on a weekly view of the US Dollar Index, market weakness may last another 12-20 weeks, while the US Dollar Index finishes waves three to five. Since a strong wave three is underway, we can expect market weakness in the near term. Wave four should bring a reprieve for two to four weeks and a probable market rise while the correction wave unfolds, before resuming the uptrend and completing wave five.

