Tough Week, we have some substantial stats.
I view this more as an opportunity, roughly speaking it's a 5-year event.
In my age bracket I may not get many more of these before the mandatory withdraws.
Friday was the 20th worst of 15.9K Daily sessions.
Thur/Fri was the 5th worst of 15.9K 2-Day sessions.
Week-14 was the 8th worst of 3.3K Weekly sessions.
For context, our Cumulative Weekly Performance from 1-13 weeks is in the bottom 3.1% (or lower) of it's Percentile Range.

Week-14's Average True Range was 11.21% ranking 21 of 3.3K or in the Top .6%
Volume was high, in the Top 7% and the % of Volume above its 13-MA was in the Top 5%
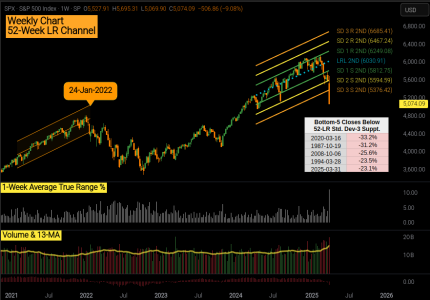
Once again I'll shift focus to the 52-Week Linear Regression Channel with Standard Deviations 1/2/3
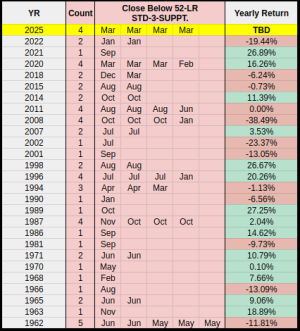
From 1962, Weekly, we've closed below 52-LR Std Dev-3 Support a total of 59 of 3.3K weeks.
Week-14 was our 4th close below this year, here are all 59 events sorted by year & month.
___The closest match I could find was 2020 with 1 in Feb & 3 in Mar.
In terms of 52-Week Linear Regression rank, Week-14 was the 5th worst at -23.1% (calculated from the LR-52 Std-3 Support & Resistance range).
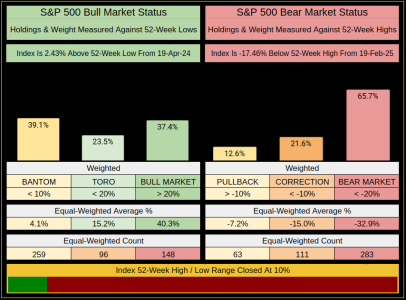
Are we in a Bear Market yet?
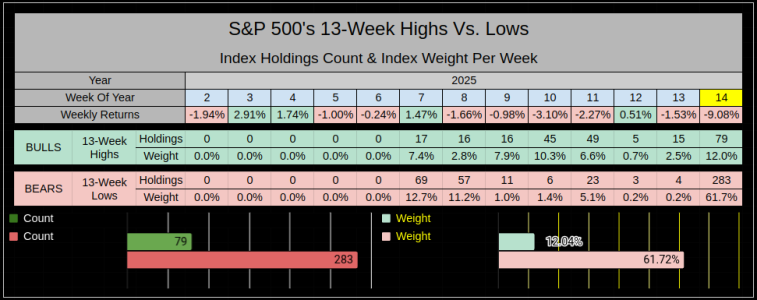
While the index has not reached the technical threshold of -20% from the highs, the chart below shows the internals are already there.
Case in point, (far right column) by Index weight, 65.7% of the index is <20% below their highs, with the average of those 283 holdings at -32.9%
The Index is at 10% of its 52-Week High/Low Range, we are only 2.43% above our 19-Apr-2024 52-Week Low.
This is impressive
Week-14 gave us 148 new 52-Week Lows, and 257 new 26-Week lows.
We are at the bottom of the 3/6/13/26/52-Week Index High/Low Price Range.
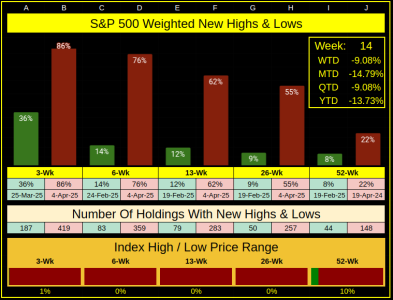
Week-14 lost -9.08% that's the 8th worst close of 3.3k weekly closes, this is a bottom .2% percentile range event.
By Index Weight, the Bears outpaced Bulls 61.7% to 12% and by holdings 283 to 79.
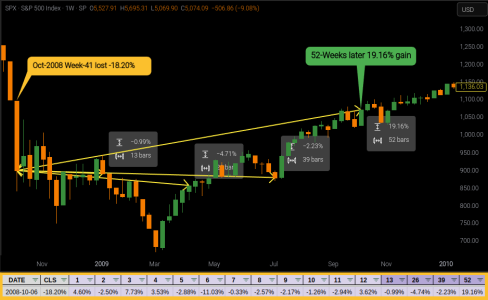
Last crucial piece of data, I told you Week-14 was the 8th worst, so we'll look at 1-13, 26, 39, & 52 weeks of performance after the absolute worst week from the past 63 years.
Week-41 of 2008 is the worst on record, with a -18.20% loss, 52 weeks later the market was up 19.16%
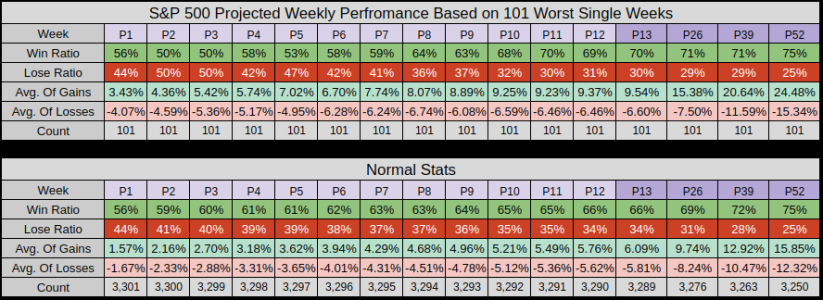
Wrapping this up, here's the cumulative performance of the index after the 101 worst weeks Vs. Normal stats.
Statistically speaking as bad as it is now, it's not likely to be so bad 13 to 52 weeks later.
My impression, the stats are weaker out to Week-P7 then the win ratio stabilizes.
We also notice the average of gains & losses is larger than the normal stats.
Thanks for reading, have a great Week-15 ... Jason
I view this more as an opportunity, roughly speaking it's a 5-year event.
In my age bracket I may not get many more of these before the mandatory withdraws.
Friday was the 20th worst of 15.9K Daily sessions.
Thur/Fri was the 5th worst of 15.9K 2-Day sessions.
Week-14 was the 8th worst of 3.3K Weekly sessions.
For context, our Cumulative Weekly Performance from 1-13 weeks is in the bottom 3.1% (or lower) of it's Percentile Range.

Week-14's Average True Range was 11.21% ranking 21 of 3.3K or in the Top .6%
Volume was high, in the Top 7% and the % of Volume above its 13-MA was in the Top 5%
Once again I'll shift focus to the 52-Week Linear Regression Channel with Standard Deviations 1/2/3
From 1962, Weekly, we've closed below 52-LR Std Dev-3 Support a total of 59 of 3.3K weeks.
Week-14 was our 4th close below this year, here are all 59 events sorted by year & month.
___The closest match I could find was 2020 with 1 in Feb & 3 in Mar.

In terms of 52-Week Linear Regression rank, Week-14 was the 5th worst at -23.1% (calculated from the LR-52 Std-3 Support & Resistance range).

Are we in a Bear Market yet?
While the index has not reached the technical threshold of -20% from the highs, the chart below shows the internals are already there.
Case in point, (far right column) by Index weight, 65.7% of the index is <20% below their highs, with the average of those 283 holdings at -32.9%
The Index is at 10% of its 52-Week High/Low Range, we are only 2.43% above our 19-Apr-2024 52-Week Low.

This is impressive
Week-14 gave us 148 new 52-Week Lows, and 257 new 26-Week lows.
We are at the bottom of the 3/6/13/26/52-Week Index High/Low Price Range.

Week-14 lost -9.08% that's the 8th worst close of 3.3k weekly closes, this is a bottom .2% percentile range event.
By Index Weight, the Bears outpaced Bulls 61.7% to 12% and by holdings 283 to 79.

Last crucial piece of data, I told you Week-14 was the 8th worst, so we'll look at 1-13, 26, 39, & 52 weeks of performance after the absolute worst week from the past 63 years.
Week-41 of 2008 is the worst on record, with a -18.20% loss, 52 weeks later the market was up 19.16%

Wrapping this up, here's the cumulative performance of the index after the 101 worst weeks Vs. Normal stats.
Statistically speaking as bad as it is now, it's not likely to be so bad 13 to 52 weeks later.
My impression, the stats are weaker out to Week-P7 then the win ratio stabilizes.
We also notice the average of gains & losses is larger than the normal stats.

Thanks for reading, have a great Week-15 ... Jason
Last edited:
