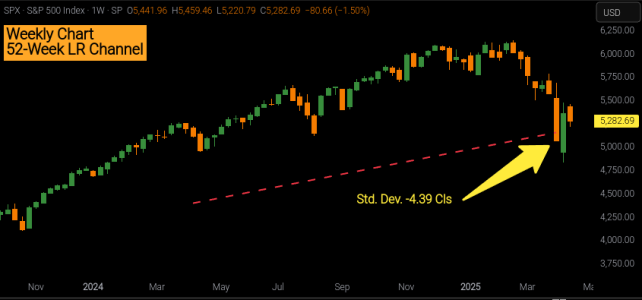
Previously, during Week 14’s April low, the S&P 500 briefly dipped more than -20% from its high, this also resulted in a breach of standard deviation -4 of the 52-week Linear Regression Channel. To call this a rare event is an understatement. The theoretical odds of price falling below -4 on any given week are just 0.003% (about 3 in 100,000).
In reality, markets don’t always play by the theoretical rulebook. Since 1961, the S&P 500’s weekly chart has temporarily breached the -4 standard deviation 39 times about 1.18% of all weeks. Digging down further, when we focus strictly on weekly closes, that number drops to just seven occurrences, or 0.21% of the time (roughly 1 of 472 weeks).
“We the People” in 2025, with the red dashed line marking the -4 Std. Dev.
___Sry I had to re-post this (forgot to backdate the channel 2 weeks).

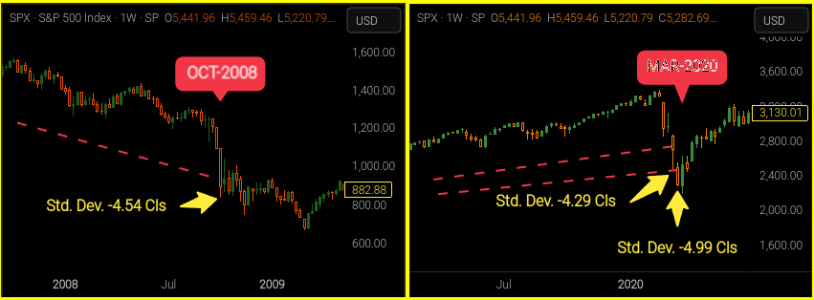
Left chart is Oct-2008 which looks to be about the worst case scenario we've encountered. Wk-41 of 2008 lost -18.20%
__If you held during this time, 22 weeks later you'd be down another -24% before we hit bottom.
The right chart shows the COVID double tap — two back-to-back breaches below the -4 standard deviation line, followed by a 10.26% reversal.
___There’s a notable difference in performance after each breach:
______13 weeks after the first tap, the market was up 12.18%.
______13 weeks after the second, the market was up 34.40%.

Four down, three to go.
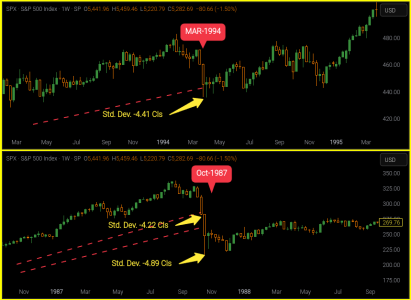
The upper chart reflects March 1994, during the Fed’s monetary tightening cycle.
___Note: while not perfectly visualized, the raw data confirms a breach below -4
___I’d classify this as a relatively mundane correction within a broader consolidation phase.
The lower chart captures October 1987, another double tap, and arguably the second-worst event we've seen.
The maximum drawdown from the peak was -35.93%, and it took 101 weeks to fully recover the losses.

Below, you’ll find the receipts showing a rolling 1-13 weeks of cumulative returns following each breach.
___2025 shares similarities with each of the previous breaches, I asked AI for a comparison with the other breaches, here's the output.
October 2008 — but only the early phase.
April 2025 shares the -4σ breach, the deep drawdown, and the sense of prolonged pressure.
However, 2025 lacks the panic/crisis feel, making it more orderly — like 1994’s structure, but with 2008’s magnitude.

Have a great weekend....Jason
In reality, markets don’t always play by the theoretical rulebook. Since 1961, the S&P 500’s weekly chart has temporarily breached the -4 standard deviation 39 times about 1.18% of all weeks. Digging down further, when we focus strictly on weekly closes, that number drops to just seven occurrences, or 0.21% of the time (roughly 1 of 472 weeks).
“We the People” in 2025, with the red dashed line marking the -4 Std. Dev.
___Sry I had to re-post this (forgot to backdate the channel 2 weeks).

Left chart is Oct-2008 which looks to be about the worst case scenario we've encountered. Wk-41 of 2008 lost -18.20%
__If you held during this time, 22 weeks later you'd be down another -24% before we hit bottom.
The right chart shows the COVID double tap — two back-to-back breaches below the -4 standard deviation line, followed by a 10.26% reversal.
___There’s a notable difference in performance after each breach:
______13 weeks after the first tap, the market was up 12.18%.
______13 weeks after the second, the market was up 34.40%.

Four down, three to go.
The upper chart reflects March 1994, during the Fed’s monetary tightening cycle.
___Note: while not perfectly visualized, the raw data confirms a breach below -4
___I’d classify this as a relatively mundane correction within a broader consolidation phase.
The lower chart captures October 1987, another double tap, and arguably the second-worst event we've seen.
The maximum drawdown from the peak was -35.93%, and it took 101 weeks to fully recover the losses.

Below, you’ll find the receipts showing a rolling 1-13 weeks of cumulative returns following each breach.
___2025 shares similarities with each of the previous breaches, I asked AI for a comparison with the other breaches, here's the output.
October 2008 — but only the early phase.
April 2025 shares the -4σ breach, the deep drawdown, and the sense of prolonged pressure.
However, 2025 lacks the panic/crisis feel, making it more orderly — like 1994’s structure, but with 2008’s magnitude.

Have a great weekend....Jason
Last edited:
