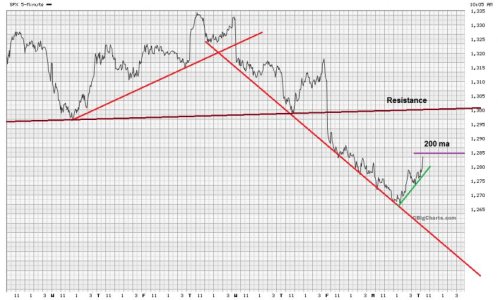
The dominant trend is still down, but various back tests are underway. SPX 200 ma is currently at 1284.95; 6.77 above the 1278.18 close on Monday, June 4, 2012. Above that, the 1290’s area is significant resistance. It previously was support when the market bounced off it on May18 at 1292, May 23 at 1297 and May 31 at 1299. I expect a stop at one of these areas.
Meanwhile the US dollar had a mini-H&S breakdown on the futures, and backed down to test the 82.4 area overnight. It could drop as low as 81.78 to test the top of the cup and breakout point on the weekly USD chart. However, I believe that the trend is still solidly up.
Based on the preceding SPX Elliott wave, from 1320 to 1267, a 0.382 fibonacci retracement lands at 1284 near the 200 ma. A 0.618 fibonacci retracement lands at 1300, on the slightly sloping up “now resistance line” connecting the 1290’s prior support bounces. This is more confirmation of a stop.

